This site uses cookies to improve your experience. To help us insure we adhere to various privacy regulations, please select your country/region of residence. If you do not select a country, we will assume you are from the United States. Select your Cookie Settings or view our Privacy Policy and Terms of Use.
Cookie Settings
Cookies and similar technologies are used on this website for proper function of the website, for tracking performance analytics and for marketing purposes. We and some of our third-party providers may use cookie data for various purposes. Please review the cookie settings below and choose your preference.
Used for the proper function of the website
Used for monitoring website traffic and interactions
Cookie Settings
Cookies and similar technologies are used on this website for proper function of the website, for tracking performance analytics and for marketing purposes. We and some of our third-party providers may use cookie data for various purposes. Please review the cookie settings below and choose your preference.
Strictly Necessary: Used for the proper function of the website
Performance/Analytics: Used for monitoring website traffic and interactions
Personally, I’m a big fan of the cost per hire metric. Back in 2012, the Society for Human Resource Management (SHRM) worked with the American National Standards Institute (ANSI) to create a uniform standard calculation for cost per hire (CPH). Now, I get it…there’s lots of talk about quality of hire being the best recruiting metric.
To achieve this, the company hired an HR business intelligence team, standardized their reporting metrics, and invested over $3 million in a data warehouse and business intelligence (BI) software. Analysts to determine metric definitions and create reports. Data warehouse software licenses. Data integration tools licenses.
Demonstrating the business value that HR provides by putting metrics in place. Redefining the metrics of success, with metrics focused on business challenges rather than favored, traditional (read “non-business relevant”) HR metrics. Numbers behind HR – benchmarking & analytics. Enabling HR service delivery.
Identifying opportunities for improvement based on pre-determined goals and metrics is a key goal of performance appraisals. Have the tools to set future performance goals – The goals and benchmarks your company is achieving now are a good indication of what goals to set in the future and at what pace your business can achieve them.
HR professionals are generally very good at reporting and benchmarking, but not as good at more sophisticated analytics. A Mercer survey found that 69 percent of business executives do not believe HR professionals possess an adequate skill level to perform more sophisticated analysis.
If you aren't already familiar with their Benchmark Pro and other survey products, please check them out! Links for historical Turnover Rates: 2008 , 2009 , 2010 , 2011 , 2012, 2013 , 2014 and 2015.
We also have over 25 years of normative (also known as a benchmark) data that has been collected through ExitRight® our flagship product. Since we first published this data in 2012, workload and job demands have risen in importance, while the need to feel recognized, appreciated and respected has shifted down two spots, industry-wide.
We also have over 25 years of normative (also known as benchmark) data that has been collected through ExitRight® our flagship product. ExitRight benchmarks for healthcare show that 80 percent of turnover is caused by preventable employer factors. The post Top Five Turnover Causes in Healthcare appeared first on HSD Metrics.
Paycor reviewed proprietary data from nearly 30,000 customers and found that many standard HR and recruiting metrics are tactical, in that they track project management, or, at most, basic dollar-in, dollar-out cost analysis. The most successful HR teams map people management metrics to business outcomes.
Strategic HCM invites you to participate in the CedarCrestone HR Systems Survey (until July 5) CedarCrestone is requesting participation in the 2011-2012 HR Systems Survey: HR Technologies, Service Delivery Choices, and Metrics Survey, 14th Annual Edition through July 5, 2011. HCM technology'
Tuesday, 4 December 2012. There are two issues I think recruiters, and other HR professionals, need to understand in order to get to grips with this more important objective / metric. Induction Reports: Measure global metrics on HR productivity and key performance benchmarks. ▼ 2012. 6 months ago. 1 year ago.
Friday, 27 April 2012. Productivity and labour cost remain important measurements; these are the tools investors, lenders and businesses use to benchmark progress (or lack of it). ▼ 2012. Gamification - thats the name of the game HR. 6 months ago. SuccessFactors Performance and Talent Management Blog. 1 year ago.
3 Cisco’s study of 2000 of their teleworkers in five global regions provided an estimated $277 million in annual productivity savings, and more than 47,000 metric tons of greenhouse gases avoided. site visits, benchmarking visits, celebration of an organization accomplishment). The Forum (2012). References. Lassk, F., &
Cost-per-hire (CPH) is one of the most intriguing recruiting metrics. The way companies calculated cost-per-hire varied until HR leaders created a standard formula in 2012. SHRM and ANSI define this additional cost-per-hire metric. This metric can be more useful than CPH. It’s vital to some, but opaque to others.
The readers will develop insights into the topics like primary metrics, KPIs, and processes involved in different HR subdomains like recruitment and employee engagement.” Tracing changes in a global sample of firms, it provides an international benchmark against which to measure a company’s HR practice.
In addition, Australia passed the Workplace Gender Equality Amendment (Closing the Gender Pay Gap) Bill (WGEA) in 2023, which requires companies with over 100 employees to publish their gender pay metrics and report them to their boards and governing shareholders. These metrics can include: Salary range penetration. Career path ratio.
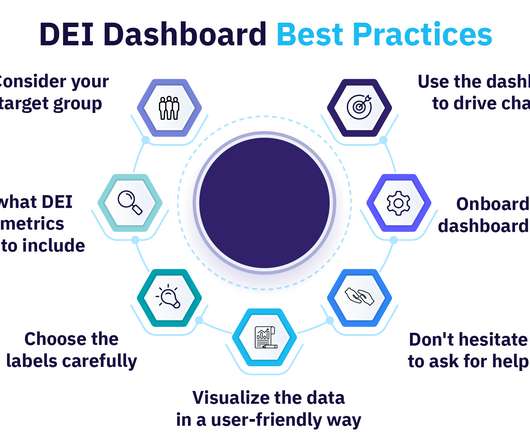
57% of these organizations are implementing diversity metrics and programs. While many companies are raising their game tracking DEI, there’s a demand for more visibility and insight into these metrics. Decide what DEI data and metrics you want to include. Contents What is a DEI dashboard? Why do you need a DEI dashboard?
Outcome transparency involves disclosing the actual compensation figures, such as specific salary ranges or benchmarks for different roles and levels within the organization, allowing employees and candidates to see where their pay stands relative to those benchmarks. This isn’t theory. Here are a few to get you started: 1.
” Skinner retired in 2012 confident that Thompson was ready to take over. A great benchmark is to get clear on the top 5 to 10 critical positions. You can base your decisions on valuable data such as employee performance metrics. Until I was capable of doing that, I would not have left.”
We organize all of the trending information in your field so you don't have to. Join 318,000+ users and stay up to date on the latest articles your peers are reading.
You know about us, now we want to get to know you!
Let's personalize your content
Let's get even more personalized
We recognize your account from another site in our network, please click 'Send Email' below to continue with verifying your account and setting a password.


Let's personalize your content