This site uses cookies to improve your experience. To help us insure we adhere to various privacy regulations, please select your country/region of residence. If you do not select a country, we will assume you are from the United States. Select your Cookie Settings or view our Privacy Policy and Terms of Use.
Cookie Settings
Cookies and similar technologies are used on this website for proper function of the website, for tracking performance analytics and for marketing purposes. We and some of our third-party providers may use cookie data for various purposes. Please review the cookie settings below and choose your preference.
Used for the proper function of the website
Used for monitoring website traffic and interactions
Cookie Settings
Cookies and similar technologies are used on this website for proper function of the website, for tracking performance analytics and for marketing purposes. We and some of our third-party providers may use cookie data for various purposes. Please review the cookie settings below and choose your preference.
Strictly Necessary: Used for the proper function of the website
Performance/Analytics: Used for monitoring website traffic and interactions
But sometimes having that much information at our fingertips can be disabling and intimidating if we aren’t sure which metrics are worth our attention for our specific company. And let’s say you do know which KPIs will serve you well…how do you then decide on appropriate benchmarks for each metric for your business?
To achieve this, the company hired an HR business intelligence team, standardized their reporting metrics, and invested over $3 million in a data warehouse and business intelligence (BI) software. Analysts to determine metric definitions and create reports. At Visier, we refer to this as “add data and stir.” IT administrators.
If you are new to the recruiting team and are planning on hiring new candidates for different departments of your company, you need to know about the top recruiting metrics that are in trend. What are recruiting metrics? In this article, we will discuss about the top ten hiring metrics that every recruiter should focus on.
To achieve this, the company hired an HR business intelligence team, standardized their reporting metrics, and invested over $3 million in a data warehouse and business intelligence (BI) software. Analysts to determine metric definitions and create reports. At Visier, we refer to this as “add data and stir.” IT administrators.
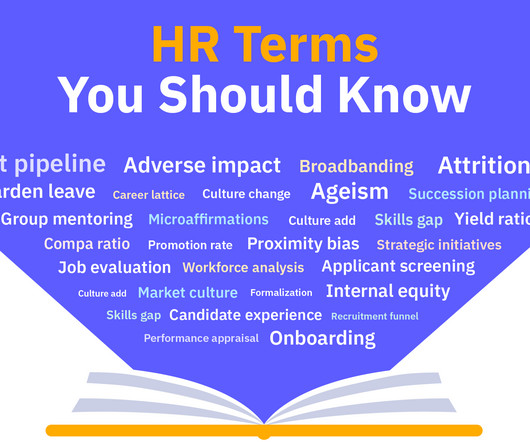
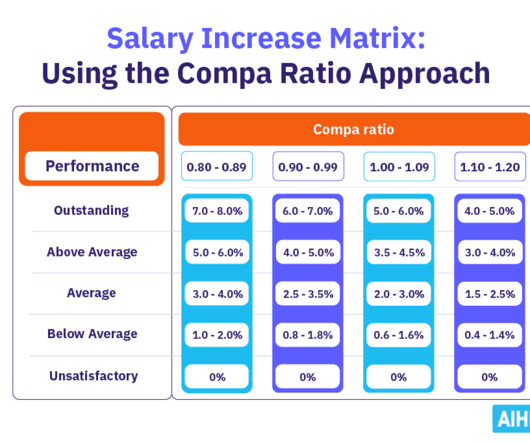
It’s a handy reference to refer to the next time you encounter an unfamiliar term. Compa ratio Compa ratio , also known as a comparative ratio, is a metric that compares an individual’s or group’s salary to the midpoint of a defined salary range. This article unpacks 93 HR terms, including a usage example for each.
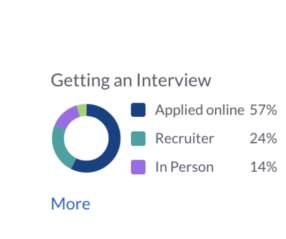
Plus, referred candidates are twice as likely to be interviewed as traditional applicants. This makes comparisons between candidates more objective and discussions more productive. Set up a system for tagging and classifying former applicants based on their skills to access them for any future vacancies.
Plus, referred candidates are twice as likely to be interviewed as traditional applicants. This makes comparisons between candidates more objective and discussions more productive. Set up a system for tagging and classifying former applicants based on their skills to access them for any future vacancies.
Blame sourcing and its metrics when youre not getting top candidates. Second, AI and machine learning are slowly creeping into sourcing and cannot operate without robust metrics and data. Most fail to measure the foundation channel success metric new-hire performance. 24% of referrals became above-average performers).
When you are talking with your clients about using newer technology in their recruiting process, be sure that you reference the time it will save in the process. In your metrics, be sure to track not only the data for newer technology, but also include the same data on older technology.
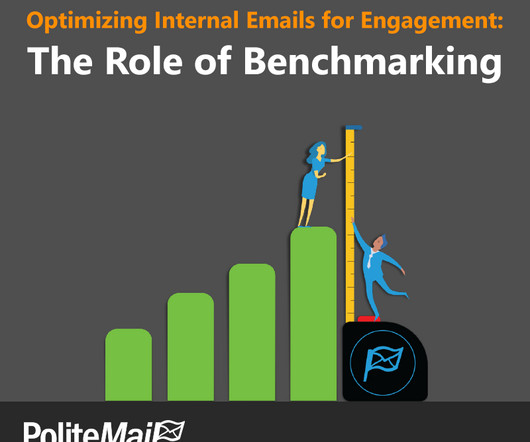
Step 1: Identify Key Engagement Metrics The initial step to calculating ROI is identifying relevant metrics that reflect the impact of employee engagement on your organization. Here are some common metrics to consider: Productivity: Keep regular track of individual and team output after implementing engagement initiatives.
Let’s take a look at some of the alluring benefits Mazor references. Identifying, rinsing and repeating what’s working A striking feature of talent acquisition analytics is the ability to measure the success of your recruitment efforts with quantifiable metrics. Measuring recruitment success is an imperative!
By comparison, providing training and growth opportunities helps drive engagement which in turn leads to higher job satisfaction, better productivity and improved retention. Beyond looking at performance metrics, you can also use analytics software to track the employee experience.
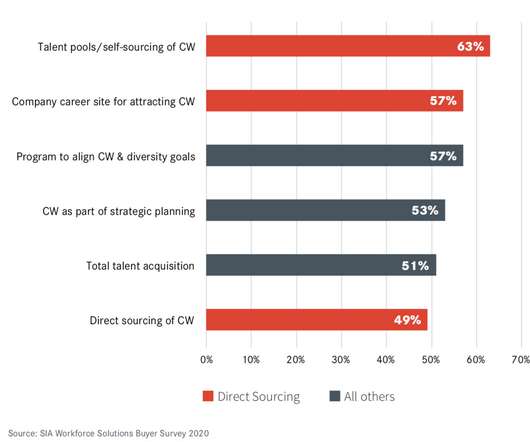
In fact, research indicates direct sourcing leaders outperform laggards by a staggering factor of 4:1 across all key metrics. By comparison, you would need 15 shortlisted candidates from traditional job ad sources to find a successful candidate. Do leaders and laggards have different types of challenges? Probably not.
An essential part of developing an impactful annual HR report is including the right metrics to clearly quantify how HR is impacting strategic goals and organizational performance. Contents What is an annual HR report Metrics to include in an annual HR report How to prepare the annual HR report. What is an annual HR report?
Benchmarking plays a crucial role in business, whether it involves internal assessments or comparisons with industry standards. By evaluating metrics such as sales and employee retention rates, companies can determine their strengths and weaknesses in relation to both their own past performance and that of their competitors.
Turnover and retention reports Attrition reports, commonly referred to as turnover reports, emphasize the number and the percentage of individuals who quit during a specific time period. Before and after making a substantial change, consider how you’ll keep past data for comparison or to assess your performance.
The decision matrix is a tool for comparison, and for enhancing objectivity and efficiency in the decision-making process. This standardization helps reduce bias and ensures fair and meaningful comparisons among alternatives. Options or alternatives: This is where you list the various choices under consideration.
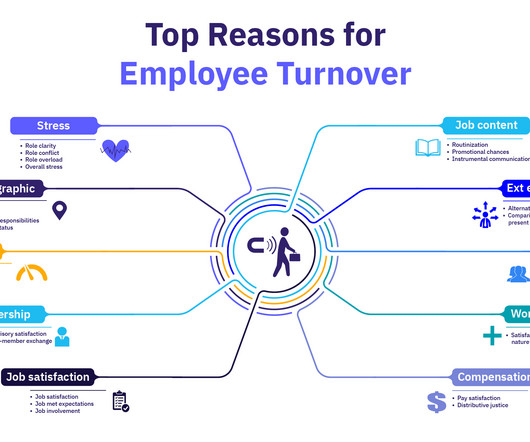
Employee turnover refers to the rate at which employees leave a company within a specific time frame, often measured annually. Dysfunctional turnover : This refers to the loss of high-performing or valuable employees, which negatively impacts the organization. There is a subtle difference.
The system provides transparency into pipeline diversity metrics throughout the sourcing process. Here are some essential metrics to track: Metric Description Importance Time to Hire Average days from job posting to candidate acceptance. Look for systems that surface meaningful patterns and help predict hiring outcomes.
In future posts I may cover many sessions I missed, with some references that I read to recover my horrible FOMO (fear of missing out). #1. While we talk about ROI (Return of investment), this is actually a short terms financial return, in comparison with competitive advantage, which is a long term financial return.
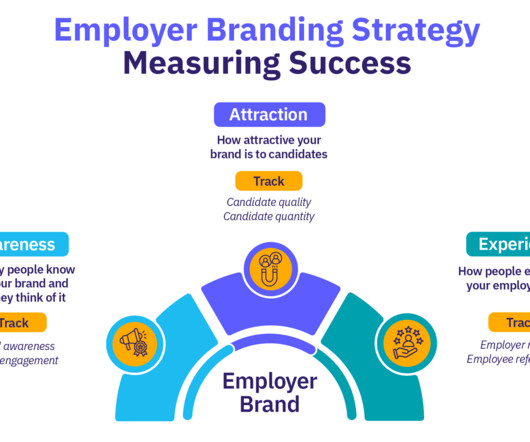
Employer branding metrics are the key to understanding your employer brand’s influence. Let’s dive into the twelve employer branding metrics you need to know. Contents What are employer branding metrics? How to measure employer branding: Metrics examples. What are employer branding metrics?
Pay disparity refers to the adjusted metric after controlling for legitimate business factors; for example, most organizations use tenure as a legitimate business reason for making a compensation decision. DEI metrics reporting is increasingly being demanded by shareholders , who expect to see improvement in these metrics over time.
The SOAR matrix explained The SOAR matrix (also referred to as a SOAR framework) is a strengths-based strategic planning model that helps HR professionals align workforce initiatives with business objectives. Additionally, set leadership equity goals and track inclusion metrics. SWOT: What are the differences?
With voluntary resignations at an all-time high and unemployment rates historically low, employee retention is a key objective for most HR organizations, and employee turnover is the single most prevalent HR metric. These metrics help you accomplish this task: Resignation Rate. Impact on Business Metrics. Senior managers?
With voluntary resignations at an all-time high and unemployment rates historically low, employee retention is a key objective for most HR organizations, and employee turnover is the single most prevalent HR metric. These metrics help you accomplish this task: Resignation Rate. Impact on Business Metrics. Senior managers?
Leadership effectiveness refers to a leader's ability to positively influence and coordinate their team members' (or immediate subordinates') efforts to achieve organizational goals. In comparison, only around 20% of organizations have agreed to have capable leaders. What Is Leadership Effectiveness?
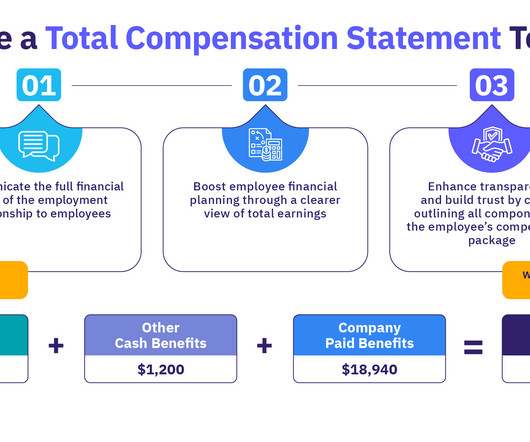
Include a side-by-side comparison of scenarios with and without employee contributions to encourage participation and showcase the significant value these benefits deliver to employees by supporting their long-term financial security. market benchmarks, performance metrics ).
However, developing a strong retention strategy centered around meaningful metrics can lead to happier, more productive employees and significant cost savings for a company. As an HR professional, what retention metrics should you be tracking? Key Takeaways What are Employee Retention Metrics? Importance of Retention Metrics.
Compa Ratio = Actual Rate of Pay / Reference Point of Pay. where the actual rate of pay can be an individual, a group, or an entire workforce, and the reference point of pay is: the midpoint of a defined salary range, the average market rate or market midpoint, or. Using compa ratio in your compensation strategy. What is compa ratio?
In fact, organizations are often using so many different metrics in their attempts to measure employer brand ROI that they get lost or aren’t sure what impact they are really having or they are forgetting critical data. Alternatively, they aren’t tracking any metrics at all and as we all know…. ” – Peter Drucker.
As a manager, it is essential to understand the metrics that measure employee engagement and how to effectively analyse and use that data to improve your team’s engagement levels. Employee engagement refers to the emotional commitment, enthusiasm, and dedication of employees towards their work and the organisation they work for.
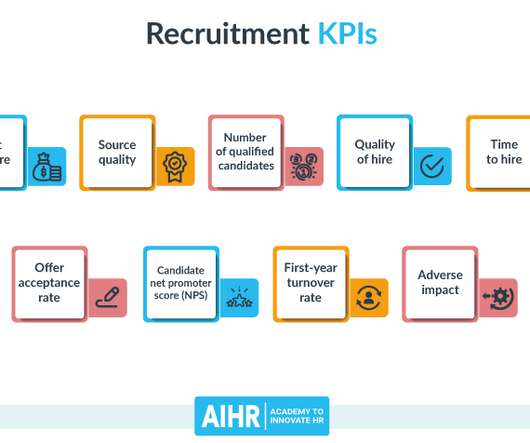
KPIs (key performance indicators) are strategic metrics tied to an organization’s short and long-term goals. What’s the difference between recruitment KPIs and metrics? KPIs are also metrics, but they are the most vital measures for your organization and should be specifically tied to company goals and objectives.
If the metrics are getting mixed up in your mind, here’s a quick-and-dirty overview of the five most common SaaS sales metrics, and what they mean for productivity. What Are SaaS Sales Metrics? SaaS sales metrics are the numbers that show how sales, and only sales, are going. The 5 Most Important SaaS Sales Metrics.
Sometimes referred to as a salary package, an employee compensation package is the overall combination of financial and non-financial rewards that employees receive in exchange for their work. Consider the total package value, not just the base salary, when making comparisons.
Make sure employee goals are: Well defined without being impossible Specific to jobs and the company overall Attached to important metrics These parameters can be accomplished via SMART goals that are S pecific, M easurable, A chievable, R elevant, and T imely. Measurable: Metrics allow you to define progress, improvement, and success.
Printed Materials: Learners receive manuals, handouts, or guides as references during their training. Paradiso LMS provides real-time analytics that track key metrics such as course completion rates, learner progress, and performance assessments. With a modern LMS, tracking and reporting are automated and accurate.
In this age of data, every area of a company is generating a lot of metrics to analyse. So how do you decide what are the right recruiting metrics to focus on? The first step is to understand not only each metric but what story the numbers tell. Key Recruiting metrics. This is quite a straightforward metric.
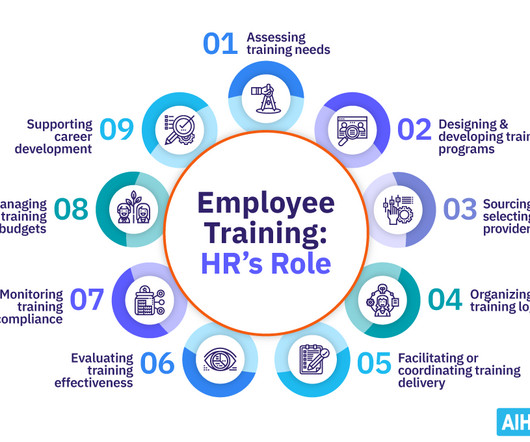
Employee training benefits Methods of employee training 7 Steps to develop an employee training program Employee training systems Training effectiveness metrics Employee training plan template What is employee training? Job aids/References Tools/resources providing quick references and support.
So it’s not surprising that metrics have become an important way to understand what’s working and what isn't. Here are eight of the most important metrics HR can track. This statistic is cited by the Society for Human Resources Management ( SHRM ) as one of the top most helpful HR metrics. Cost per hire.
William Tincup (President at RecruitingDaily) referred to the employer brand as “your unique scent as a company.” In comparison, 75% of job seekers are likely to apply if the organization is actively managing its brand. Select relevant metrics to track. This refers to how attractive your brand is to candidates.
This guide to high-performing B2B marketing funnels in 2024 covers essential steps, actionable tactics, the latest tools, and key metrics to optimize your results and drive growth. Measurable ROI: A structured funnel allows you to track key metrics at each stage, allowing you to identify what’s working and what’s not.
Benefits of HR Infographics in Data Analysis Simplifying Complex HR Data HR departments deal with vast amounts of data related to employee performance , turnover rates, recruitment metrics, and more. Infographics make it easier for stakeholders at all levels to understand HR metrics and insights without being overwhelmed by technical jargon.
Additionally, referred candidates often exhibit a strong sense of engagement from the beginning, thanks to their existing connections within the organization. They also minimize bias and enable a more accurate comparison of candidates, ultimately facilitating more well-informed hiring decisions.
With visual and real-time performance metrics, leaderboards can encourage employees to take ownership of their work decisions and possible consequences. According to this theory, social comparison encourages people to understand their best abilities and worst attributes when looking at the people around them. Let me explain.
We organize all of the trending information in your field so you don't have to. Join 318,000+ users and stay up to date on the latest articles your peers are reading.
You know about us, now we want to get to know you!
Let's personalize your content
Let's get even more personalized
We recognize your account from another site in our network, please click 'Send Email' below to continue with verifying your account and setting a password.


Let's personalize your content