This site uses cookies to improve your experience. To help us insure we adhere to various privacy regulations, please select your country/region of residence. If you do not select a country, we will assume you are from the United States. Select your Cookie Settings or view our Privacy Policy and Terms of Use.
Cookie Settings
Cookies and similar technologies are used on this website for proper function of the website, for tracking performance analytics and for marketing purposes. We and some of our third-party providers may use cookie data for various purposes. Please review the cookie settings below and choose your preference.
Used for the proper function of the website
Used for monitoring website traffic and interactions
Cookie Settings
Cookies and similar technologies are used on this website for proper function of the website, for tracking performance analytics and for marketing purposes. We and some of our third-party providers may use cookie data for various purposes. Please review the cookie settings below and choose your preference.
Strictly Necessary: Used for the proper function of the website
Performance/Analytics: Used for monitoring website traffic and interactions
Each year, we sponsor the SPI Professional Services Maturity Benchmark Report , a comprehensive survey of thousands of professional services organizations. This is clearly borne out by this year’s 2025 Professional Services Maturity Benchmark. Project overruns rose to 11.3% in 2024, a slight increase from 9.6%
Edcor has deployed an industry-leading, detailed customer service measurement tool that provides agents with actionable insights into their performance daily using a combination of traditional contact center metrics, post-call survey results, and speech analytics. This keeps our teams on their A-game. Think Edcor. Think Possible. Adrienne L.
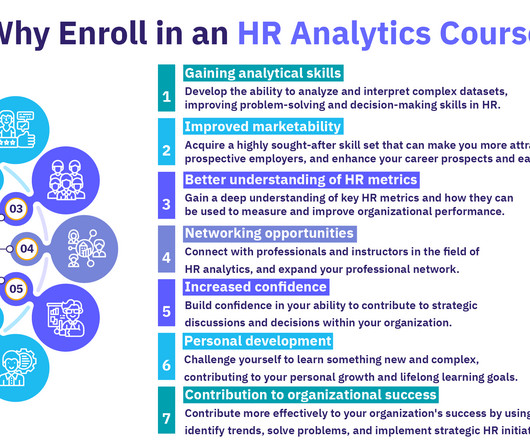
There are numerous Human Resources analytics courses available that range from basic statistical knowledge to HR data and metrics and more. While this course does present an overview of people analytics theory and some of its basics, it does not teach complex data analysis. Use data visualization to present findings.
Today’s competitive and rapidly-changing employment landscape presents challenges for employers in attracting and retaining talent. In fact, according to Zywave’s 2022 Attraction and Retention Benchmarking Overview, finding and keeping great employees is considered one of the top-five problems by 75% of businesses surveyed.
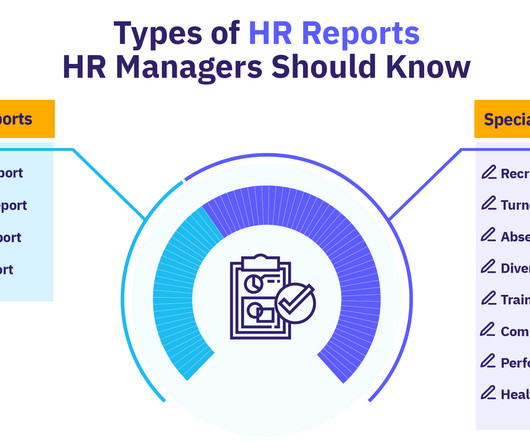
HR reports are strategic tools to showcase HR metrics and data, providing a detailed overview of your organization’s workforce and Human Resources activities. Key metrics to include are the total headcount, departmental breakdown, diversity metrics (e.g., Contents What is an HR report?
According to Gartner, 58% of organizations say a lack of relevant metrics to track HR progress is one of the top barriers to effective strategic planning. Most other business functions have a standard set of metrics that show the effectiveness of their team and how they’re contributing to the company’s bottom line (e.g.,
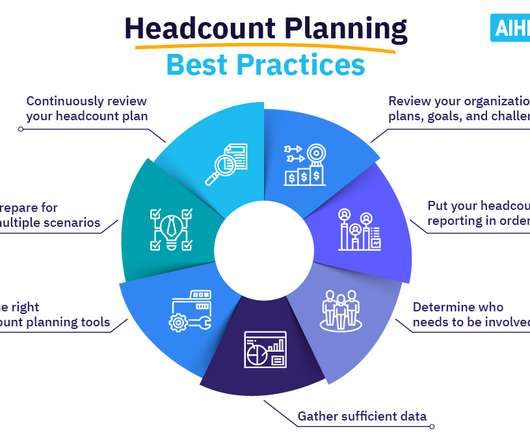
Forecasting should be part of your headcount planning to evaluate previous trends, the present situation, and future events. Create a headcount report dashboard to gain accurate information on your current headcount status and key metrics in real-time. It can also make critical metrics visible and generate real-time reports on demand.
Workforce planning and forecasting starts with measuring your teams efforts and metrics, understanding their limitations and the workloads they can handle to maintain optimum performance. When building a workforce planning model, consider how the information you’re presenting achieves the following: 1.
Bullhorn Analytics not only streamlines data collection from various sources but also makes data accessible by automatically capturing and processing data in real-time and presenting insights through dashboards and interactive reports for easy access. Similarly, you can track engagement and retention metrics for candidates.
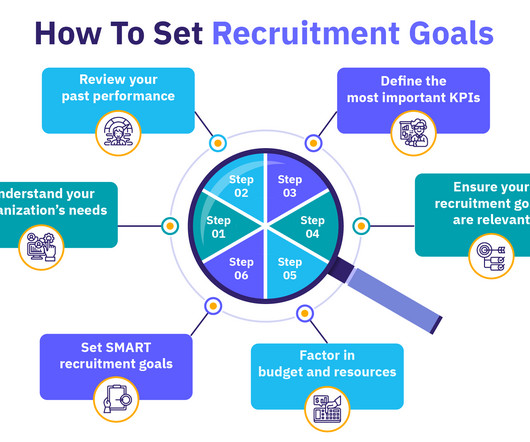
Enjoy steady progress: Consistent goal setting and measurement of outcomes provide you with benchmarks to track progress, assess the effectiveness of your recruitment strategies , and tackle areas for improvement. Use metrics to evaluate your past performance. Include quantifiable metrics to track progress towards your goals.
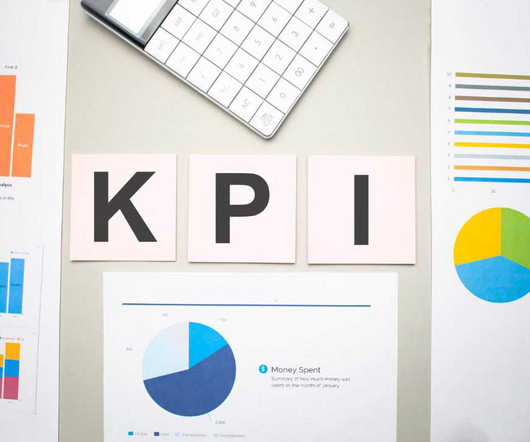
By keeping track of essential HR metrics like employee turnover rate, time to fill, and recruitment costs — you’ll have a solid grasp of your strengths and top areas for improvement. A key performance indicator is a metric that measures the effectiveness of something, and it can take all sorts of forms. They provide accountability.
Benchmarking plays a crucial role in business, whether it involves internal assessments or comparisons with industry standards. By evaluating metrics such as sales and employee retention rates, companies can determine their strengths and weaknesses in relation to both their own past performance and that of their competitors.
Organizations can use technology to access the right data and industry benchmarks. In a recent Bloomberg HR department benchmark study, 38% of HR professionals said their use of metrics and analytics was adequate. That access to timely, relevant data allows the organization to make the business case for change.
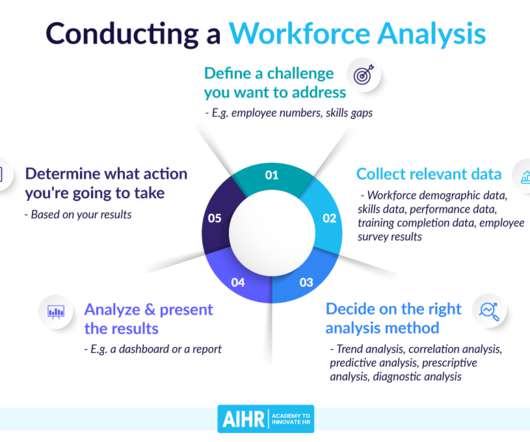
Organizations can offer existing employees further training, nurture potential, set performance benchmarks, and map succession paths for the most promising talent. Metrics such as productivity levels and undesired behaviors of ill-suited employees can be tracked. Analyze and present the results. Improve company culture.
Your responsibilities will include: Develop standard and ad hoc reports, templates, dashboards, scorecards, and metrics. Research, analyze, and present data as assigned. Responsible for collecting and presenting data on a regular basis. Collecting, presenting and communicating data to key stakeholders. Responsibilities.
In a 2016 survey from The Work Place Group, 96 percent of respondents said source of hire is an important metric for making recruiting strategy decisions. Here's the issue: 60 percent of those people also rated the metric as less than 90 percent accurate. (If
Identifying, rinsing and repeating what’s working A striking feature of talent acquisition analytics is the ability to measure the success of your recruitment efforts with quantifiable metrics. For this reason, a lack of ability to streamline and benchmark recruiting efforts against goals is a common challenge without the right tools.
Bullhorn Analytics not only streamlines data collection from various sources but also makes data accessible by automatically capturing and processing data in real-time and presenting insights through dashboards and interactive reports for easy access. Similarly, you can track engagement and retention metrics for candidates.
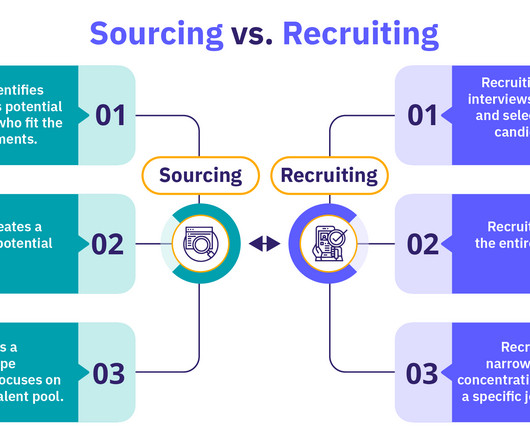
In the Employ’s Quarterly Insight’s report , benchmark data indicates that one-third of the time spent hiring is on sourcing, regardless of how fast the hiring process is. The goal is to build a qualified talent pool that can be recruited for future roles.
Thousands of various data points and metrics can be used to describe your workforce, but gathering all of the data in one place and seeing it in an easy-to-understand format can be tricky. Workforce analytics software compiles all of your data in a central location, where you can evaluate and compare a variety of metrics.
We will cover content on the strategic role of the HR business partner, the basics of HR metrics & analytics, communication skills, employee experience, and the future of work. HR Business Partner Benchmarking Report The HR business partner role is evolving. Human Resources KPIs: An In-depth Explanation with Metrics & Examples.
A brief case studie is presented in an article written by Tony Brugman and Rob van Dijk from their own consulting work. Absenteeism in this German 43,000 + people energy company has risen above benchmark. the UK retail business has systematically out-performed internal targets and external benchmarks, year on year.
After this, you’ll analyze and compare their web designing skills with industry standards or competitor benchmarks using trusted sources. To communicate your EVP effectively, create a well-designed presentation that outlines the benefits and unique aspects of working at your company. Visier is a helpful tool for this.
Here’s how: Collect measurable, quantifiable data: You can use survey statistics to evaluate various metrics (e.g., employee satisfaction / employee engagement ) and benchmark them against previous quarters and top competitors. Tip 4: Benchmark the results Compare your survey results to internal, industry, or national benchmarks.
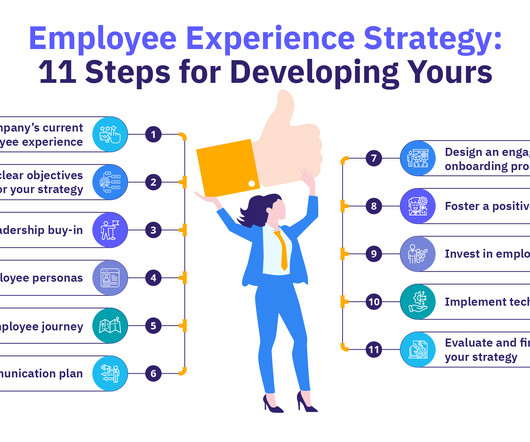
Establish and track employee experience metrics: Data provides tangible evidence of what works well and which issues to address to enhance the employee experience. This metric helps you gauge the employee experience levels in your organization. Collect employee feedback and external data to benchmark against competitors.
Only through the proper measurement and monitoring of engagement metrics will the firms understand the hidden challenges and key solutions. Regularly benchmarking compensation packages against industry standards will help your firm remain competitive and attract among the top-tier talent pool.
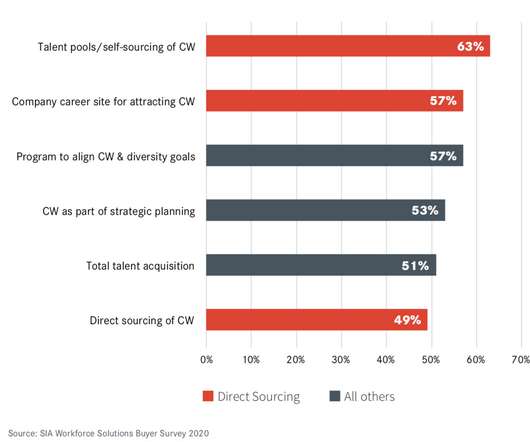
In fact, research indicates direct sourcing leaders outperform laggards by a staggering factor of 4:1 across all key metrics. With rising demands for talent, agility and cost savings, contingent workers present a vital solution for tomorrow’s global economy. Do leaders and laggards have different types of challenges? Probably not.
The underlying theme tying their two presentations together was that in order for HR to be successful with analytics, it’s necessary to connect HR goals (or your people strategy) to organizational goals (the business strategy). Below are some highlights from the presentations. It includes benchmark comparison numbers.
Market Intelligence: AI gathers real-time data on market conditions, salary benchmarks, and competitor activity, helping organizations make informed hiring decisions. Algorithmic Bias Challenge: AI models can inadvertently perpetuate or amplify biases present in the training data, leading to discriminatory outcomes.
HR metrics help organisations measure performance data and make sense of it. Through the right metrics, HR managers and leaders can learn how to better support employees and strengthen results. To observe trends, HR should measure the same metrics over time. But first, let’s take a broad look at what makes metrics so crucial.
When organizations leverage people analytics software, they gain the ability to measure workforce metrics like turnover, engagement, productivity, and more. Key Drivers for Strategic HR Organizations are realizing that a data-driven culture extends beyond traditional finance or operational metrics.
This level of specificity not only aligns your sessions with the team’s needs but also provides clear benchmarks for measuring progress. Step 4: Create Benchmarks of Success Once your program is underway, it’s essential to establish benchmarks that will help you measure success and keep the program on track.
Display Past, Present, and Future. A visual trend line reveals the historical direction, the current direction, and how the metric will shift up or down in the future. Present With Headlines vs. Topic Areas. Include a Question in the Metric. Make Benchmarks Actionable. CEOs are future-focused.
Covington, KY / January 1, 2020 – HSD Metrics®, a human resources technology company with over 230 national and international clients, welcomes experienced professional, Brittany Tony, to its high-energy team of consultants, analysts and researchers.
Recruiting metrics are an essential part of a data-driven hiring and recruitment analytics. However, if you would keep track of every recruiting metric you could find on the web, you’d have no time left to do actual recruiting! But first, let’s answer the question: What are recruiting metrics? What are recruiting metrics?
Companies with data-driven PeopleOps teams use a range of metrics to gauge their success in retaining their workforce. This article explores these employee retention metrics. We’ll look at key metrics to track, as well as calculations, best practices, case studies, and more. What are Employee Retention Metrics?
” The quote is quite apt when it comes to understanding employee training metrics because how else can you show results and make improvements? Executives are typically skeptical about investing money into training without any clear outcomes or metrics. Contents What are employee training metrics?
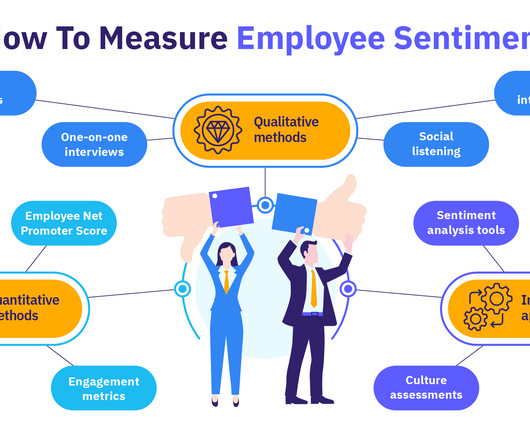
While not necessarily harmful, neutral sentiment presents a challenge for HR as it could tip toward the negative. Learn how to measure and analyze employee sentiment data Get hands-on experience on how to measure and analyze employee sentiment metrics. Neutral sentiment reflects neither positive nor negative feelings toward work.
Analyzing the gap between present staffing and future workforce needs enables filling it in an orderly, cost-effective manner that keeps productivity and growth on track. People can easily find the metrics they desire in a convenient, easy-to-use platform. Being above the benchmark should aid in attracting applicants.
The narrative in this piece weaves various annotated and interactive data visualizations into text that presents a human interest angle, quotes from experts, and analysis of specific statistics. One Vice President of Sales even asked his HRBP to share the iPad presentation for his own use because he was excited by what he saw. #2.
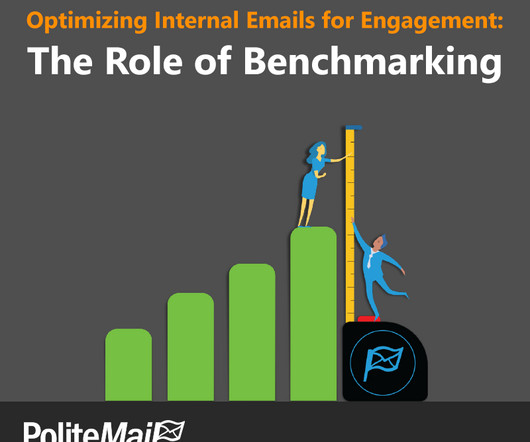
PoliteMail keep tabs on multiple metrics, from email open rates to how much time employees spend reading a message. Benchmarking and Analysis Once a method for capturing statistics is in place, internal communicators can get to work. Benchmarking is another benefit of data analytics. Registration is free.
Determine the metrics you’ll use to measure how long it does take for a new employee to be productive. These metrics will become goals for the new hire. An employee onboarding process flow chart is a powerful visual tool because it creates benchmark deadlines. Orientation is your opportunity to present your company’s mission.
Covington, KY / July 1, 2019 – HSD Metrics ® , a human resources technology company with over 220 national and international clients, welcomes experienced professional, Tina Califano, to its high-energy team of consultants, analysts and researchers. Her primary focus will be working with consultants and associations.
Data-driven problem solvers who understand key SaaS metrics like MRR, churn rate and LTV. How to Strengthen Employer Brand in 2025 From my experience, the companies that attract the best talent are intentional about how they present themselves. Heres what I recommend: Showcase company culture publicly.
We organize all of the trending information in your field so you don't have to. Join 318,000+ users and stay up to date on the latest articles your peers are reading.
You know about us, now we want to get to know you!
Let's personalize your content
Let's get even more personalized
We recognize your account from another site in our network, please click 'Send Email' below to continue with verifying your account and setting a password.


Let's personalize your content