This site uses cookies to improve your experience. To help us insure we adhere to various privacy regulations, please select your country/region of residence. If you do not select a country, we will assume you are from the United States. Select your Cookie Settings or view our Privacy Policy and Terms of Use.
Cookie Settings
Cookies and similar technologies are used on this website for proper function of the website, for tracking performance analytics and for marketing purposes. We and some of our third-party providers may use cookie data for various purposes. Please review the cookie settings below and choose your preference.
Used for the proper function of the website
Used for monitoring website traffic and interactions
Cookie Settings
Cookies and similar technologies are used on this website for proper function of the website, for tracking performance analytics and for marketing purposes. We and some of our third-party providers may use cookie data for various purposes. Please review the cookie settings below and choose your preference.
Strictly Necessary: Used for the proper function of the website
Performance/Analytics: Used for monitoring website traffic and interactions
At our Outsmart panel , Solving the Skills Challenge with Data, Ian Cook , Visier’s VP of People Analytics, spoke with three experts about the challenges of skills development in today’s workforce. This knowledge provides companies with the foundation of data they need for effective workforce planning.
Each year, we sponsor the SPI Professional Services Maturity Benchmark Report , a comprehensive survey of thousands of professional services organizations. This is clearly borne out by this year’s 2025 Professional Services Maturity Benchmark.
Workforce forecasting, once a reactive exercise based largely on historical data and guesswork, has become a strategic necessity for future-focused companies. Today, they serve as powerful data enginestracking everything from employee turnover and hiring trends to productivity, engagement, and skills development.
Data-Driven Decision Making Combining financial data—such as budgets and costs— with HR metrics, including talent acquisition and turnover rates, allows organizations to make informed decisions. This data integration enables businesses to identify trends, forecast future needs, and create a more strategic workforce plan.
Discover 5 key trends derived from Gallagher's 2023 Benefits Strategy & Benchmarking Survey data that give employers an evolved perspective on organizational wellbeing. These insights come from over 4,000 US organizations that are navigating benefits and HR decisions so their people and businesses can thrive.
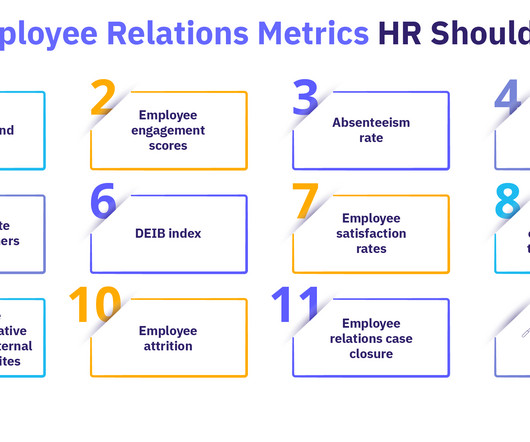
Reasons for absence : Collect data on the reasons for absenteeism to address any underlying issues, such as health concerns or workplace dissatisfaction. How to track : Separation data : Track the number of employees leaving the company within a specific period and calculate the turnover rate as a percentage of the total workforce.
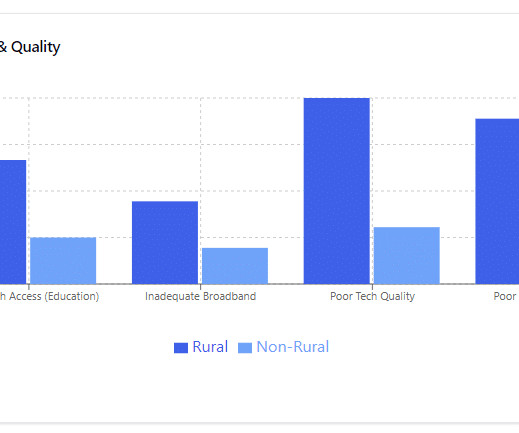
. - Advertisement - Tech deficits affect rural worker opportunities While work roles in urban areas often promote skills training, artificial intelligence and remote work opportunities, the data shows that rural communities remain largely cut off from these advances.
According to nearly 10 years of gathering data in the market, we estimate that 5,000+ technology providers exist across the entire landscape of HR, talent, learning, and related categories. This year, we are recognizing approximately 1-2% of those firms for their focus on creating solutions that solve problems their customers care about.
With advanced AI-driven insights, Bob helps HR leaders make data-informed decisions that enhance productivity and alignment across the organization. Coming in 2025, Bobs AI-powered dashboards will transform complex people data into actionable insights, helping HR leaders quickly identify trends and patterns across the organization.
The first report from Gallagher’s 2024 US Workforce Trends Report Series, includes data from 3,500+ employers who participated in the 2024 US Benefits Strategy & Benchmarking Survey. The report provides benchmarks for benefits, HR and people strategies to help organizations thrive.
Traditional comp data is really all surveys, has been for many, many years,” said Ken Allen, Salary.com’s director of product marketing. SalaryIQ aligns the findings with Salary.com’s existing data architecture. The tool analyzes the top skills associated with roles as well, providing another key piece of data to make the right offer.
Analytics Unleashed: Practical Applications in HR Analytics can be an intimidating word for many HR professionals, often conjuring images of endless spreadsheets, eye-watering pivot tables, and a level of technical complexity reserved for data scientists alone. Picture your HR data scattered like puzzle pieces across multiple tables.
Key Services: Recruitment and Talent Solutions Workforce Training and Development Managed Services and Outsourcing Assessment and Workforce Analytics Career Transition Services Why It Stands Out ManpowerGroup’s data-driven approach to workforce management and talent solutions sets it apart.
After breaking down cross-industry data on voluntary turnover, we highlight some key drivers of turnover risk and provide guidance to help you build an employee experience that makes people more likely to stay. Data in this content was accurate at the time of publication. For the most current data, visit www.apqc.org.
The 2021 Gallagher Workforce Trends Report: People & Organizational Wellbeing Strategy is informed by thousands of organizations across the United States, who participated in Gallagher’s 2021 Benefits Strategy & Benchmarking Survey. Enable employee wellbeing and drive organizational success with a data-driven approach to total rewards.
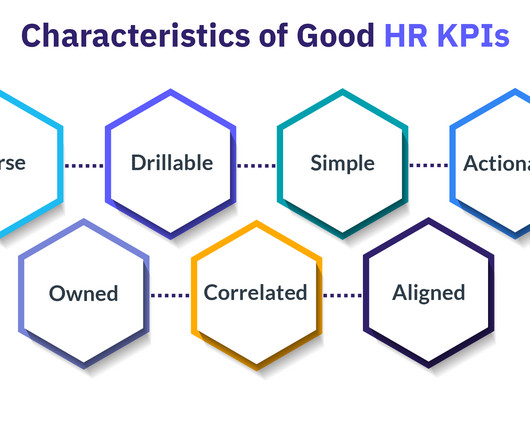
Data-driven decision-making: By analyzing KPI progress, for instance, by using an HR dashboard , HR teams can make informed, data-based decisions and choices about policies, resource allocation, and workforce strategies. Put simply, HR KPIs are not just average employee data.
Employees who have been at a company for a year or longer are more likely to take leave, and those who take leave stay up to 10% longer at their job, according to Zeise, citing internal Cocoon data. Cocoon also released in November benchmarkingdata to help companies make compassionate leave more widely available.
Many background check providers also seamlessly integrate with applicant tracking systems (ATS), allowing for real-time data updates on candidate screening status. Additionally, they can provide benchmarkingdata from similar organizations, helping to guide your hiring strategy.
Benchmarking is a practice that enables organizations to create a data-driven foundation for decision-making, provides context around performance to help identify improvements and uncovers new practices for adoption across an enterprise. What is this measure, and why does it matter?
Recognize your strengths and identify opportunities to retain valuable employees, increase employee engagement and achieve organizational goals. See where you stand against trends informed by nearly 4,000 employers and face your future with confidence.
The tool also includes skills (of around 15,000 job titles) and salary data, turnover benchmarks, global employment practices for 130 countries, and leadership development content from sources outside the firm’s typical areas of research. We’re trying to turn Galileo into like a Bloomberg terminal,” he said. “We
Predictive Analytics for Turnover Risk Predictive analytics uses historical data and machine learning to forecast which employees are most likely to leave. Analysing survey results helps HR teams pinpoint areas of concern and make data-driven decisions to improve employee satisfaction. Implementing Data-Driven Retention Strategies 1.
Regularly benchmark your compensation strategy against similar companies in your region and industry. Data-Driven Retention Strategies You can’t improve what you don’t measure. Its important to adapt your policies based on this data and evolving industry trends to maintain a competitive edge.
Workforce analytics Your employee data can offer valuable insights into workplace practices and employee satisfaction. HCM technology and practices aim to help you use this data for everyday HR decision-making. Also, these elements include compensation benchmarking. For example, HRM may concentrate on running payroll.
What comp data sources to use. How to turn market data into guidelines for pay. Understanding the market, then determining guidelines for pay isn’t just a nice to have for today’s talent, it’s a must have. Download this eBook and learn: How to choose a compensation strategy.
The platforms performance management tools enable healthcare administrators to track employee growth and set meaningful performance benchmarks. Its AI-driven HR analytics and workforce scheduling tools allow administrators to make data-backed decisions. Payroll & benefits management : Automates compensation and benefits.
This, supplemented with our thought leadership and educational resources that we share with the HR community in the form of our whitepapers, blogs, benchmark reports, and social media was commended. We celebrated our 43rd Anniversary and the CS week the first week of October.
Benchmarking sets the foundation for sustainable growth. Data guides the future. This data-driven approach is a secret weapon guiding your response to the talent drought. High-performance talent expects strong leadership, exceptional ethics skills and active listening.
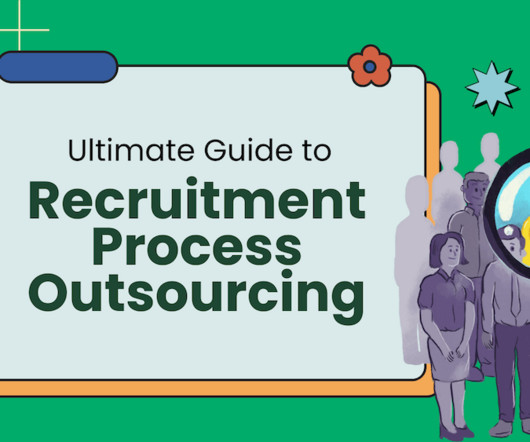
This approach allows companies to enhance their talent acquisition processes by leveraging specialized expertise, advanced technology, and data-driven recruitment strategies. By leveraging industry expertise and data-driven insights, RPO providers help companies enhance hiring efficiency, reduce costs, and improve candidate quality.
The Seven Benchmarks are an important part of building a results-oriented workplace wellness program. The data you need to collect to make your wellness programs meaningful. Organizations that are dedicated to the health of their employees are given a structure to help their organizations through the Well Workplace Process.
Succession planning with data. Fictional data used. Fictional data used. Fictional data used. Fictional data used. Fictional data used. Fictional data used. Below, I outline different ways people analytics can be used to support these processes. Readiness progression of your talent.
It’s important for any organization and its HR team to: Adopt key performance indicators (KPIs) , those metrics and benchmarks that help you define what success is and monitor and measure your progress. Make decisions based on objective data rather than gut feelings or in-the-moment pressure.
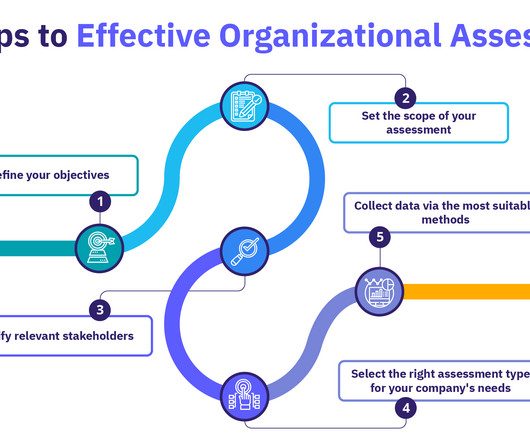
An organizational needs assessment gathers data from diverse perspectives across the company to identify barriers to goal achievement. Using a validated model can help you understand which factors to examine and how to gather the right data. You end up collecting massive amounts of data that are not helpful.
Data has shown that this results in lower graduation rates because the employees often get disengaged since they have little to no say in the school theyre going to as one of the factors, ultimately resulting in attrition, and the free education product not delivering the desired results. Think Edcor. Think Possible.
Join PayScale’s compensation experts as they show you how to build ranges from a market-centered midpoint, and how to use market data to update or create market-based pay ranges. Choose benchmark positions and slot non-benchmark positions into your pay structure.
For example, for a marketing manager role, the competencies required would be communication, data analysis, task delegation, and strategic thinking. TAKE A TOUR Step 4: Fill the Matrix Populate the matrix with the collected data. Ensure accuracy by cross-verifying the data with managers or team leads.
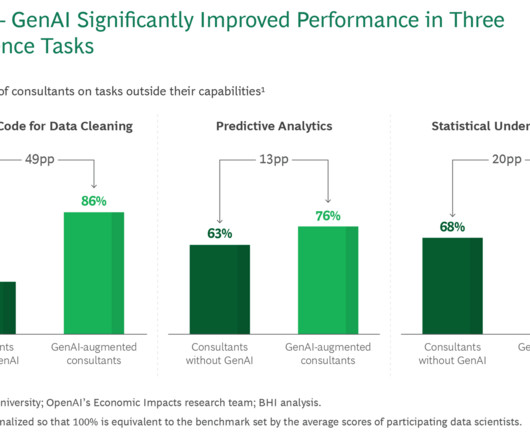
In the experiment, 480 BCG consultants attempted challenging tasks typical of data scientists, like writing Python code and building predictive models using an AI tool. Their performance was compared with 44 data scientists who worked without AI. They also completed tasks about 10% faster than the data scientists. Register now.
How to get salary benchmarking right: a quick guide for HR pros inn summary: In this blog, youll: Learn how to benchmark salaries effectively to stay competitive in the job market and ensure fair, transparent pay across your organisation. First things first: what is salary benchmarking?
A well-designed assessment will yield actionable insights, while a poorly designed one can lead to frustration and irrelevant data. A prebuilt assessment offers many advantages, including faster implementation, and robust external benchmarks. Common Pitfall : Including too few raters can lead to skewed or unreliable data.
Speaker: Apple Musni, Vice President, People Partner at Chipotle Mexican Grille
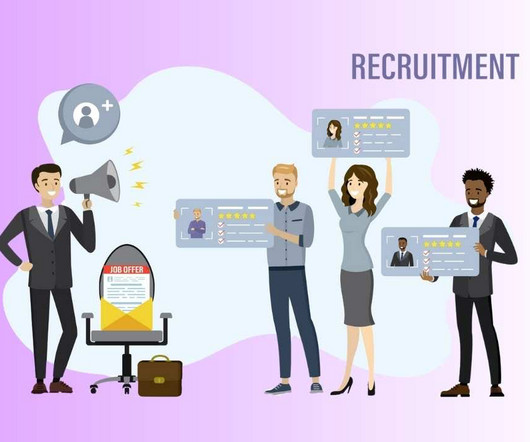
With the amount of software and data available today, teams can now create a data-driven recruitment process to help them select the right candidate and make efficient hiring plans.
Maintaining a 12-month cadence ensures that the data from these various channels is timely and relevant, enhancing the overall employee listening strategy. Extending the cadence can lead to outdated data, making it harder to respond to emerging issues promptly.
Today, more data exists about how we work than ever before. If analyzed properly, this data provides valuable insights about the trends, forces, and inequalities shaping today’s workforce—from gender pay disparities to the remote work revolution hastened by COVID-19. This is why data privacy is a high priority at Visier.
This is where benchmarking metrics for your recruiting funnel come into play. By measuring the right metrics at each stage of the funnel, you can make data-driven decisions that improve your overall recruitment strategy. Industry benchmark: On average, offer acceptance rates hover around 85-90%.
When the software is performing timesheet and invoice processing it is also collecting the data and storing it in a highly structured format. The data allows your agency to monitor the performance of recruitment consultants. This may be very useful for identifying benchmarks and setting performance targets.
This report aims to highlight the current state of B2B database and contact acquisition strategies and organizations’ goals to leverage data to fuel their go-to-market strategies in 2020 and beyond. New tactics to acquire data to reach marketing goals. Database benchmarks for education and resource prioritization.
We organize all of the trending information in your field so you don't have to. Join 318,000+ users and stay up to date on the latest articles your peers are reading.
You know about us, now we want to get to know you!
Let's personalize your content
Let's get even more personalized
We recognize your account from another site in our network, please click 'Send Email' below to continue with verifying your account and setting a password.


Let's personalize your content