This site uses cookies to improve your experience. To help us insure we adhere to various privacy regulations, please select your country/region of residence. If you do not select a country, we will assume you are from the United States. Select your Cookie Settings or view our Privacy Policy and Terms of Use.
Cookie Settings
Cookies and similar technologies are used on this website for proper function of the website, for tracking performance analytics and for marketing purposes. We and some of our third-party providers may use cookie data for various purposes. Please review the cookie settings below and choose your preference.
Used for the proper function of the website
Used for monitoring website traffic and interactions
Cookie Settings
Cookies and similar technologies are used on this website for proper function of the website, for tracking performance analytics and for marketing purposes. We and some of our third-party providers may use cookie data for various purposes. Please review the cookie settings below and choose your preference.
Strictly Necessary: Used for the proper function of the website
Performance/Analytics: Used for monitoring website traffic and interactions
Personally, I’m a big fan of the cost per hire metric. I believe the goal of calculating CPH is to provide organizations with a benchmark for their recruiting activities. Now, I get it…there’s lots of talk about quality of hire being the best recruiting metric. However, it is a complicated metric by comparison.
But sometimes having that much information at our fingertips can be disabling and intimidating if we aren’t sure which metrics are worth our attention for our specific company. And let’s say you do know which KPIs will serve you well…how do you then decide on appropriate benchmarks for each metric for your business?
To achieve this, the company hired an HR business intelligence team, standardized their reporting metrics, and invested over $3 million in a data warehouse and business intelligence (BI) software. Analysts to determine metric definitions and create reports. Data warehouse software licenses. Data integration tools licenses.
Gain Actionable Insights Using Three New UKG Ready Benchmarking Features michael.reschke Wed, 08/16/2023 - 10:25 Main Image Background Color Blue Body Benchmarking allows you to compare important data to find the most effective way to manage your talent, increasing productivity and efficiencies and giving you a competitive edge.
To achieve this, the company hired an HR business intelligence team, standardized their reporting metrics, and invested over $3 million in a data warehouse and business intelligence (BI) software. Analysts to determine metric definitions and create reports. Data warehouse software licenses. Data integration tools licenses.
It’s critical to evaluate staff strengths and weaknesses, training, education and the company’s current and long-term needs to determine which information and benchmarks are critical for defining progress or indicating that remediation is needed. Do we agree on definitions? What format communicates the message best?
Our judges particularly liked the state-by-state comparisons of different laws and requirements, giving HR leaders an easy way to understand compliance at a glance. Our team was impressed. Core HR/Workforce Best Comprehensive Solution Experian Employer Services Winner Taxes.
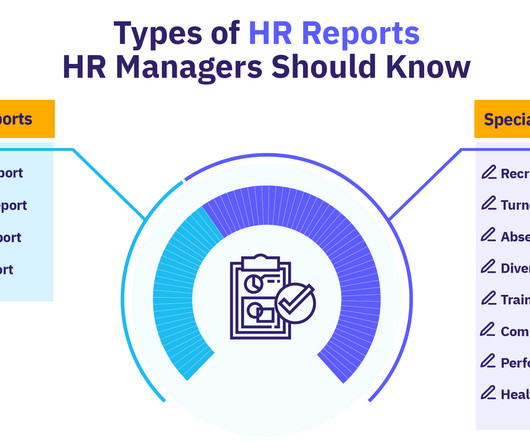
HR reports are strategic tools to showcase HR metrics and data, providing a detailed overview of your organization’s workforce and Human Resources activities. Key metrics to include are the total headcount, departmental breakdown, diversity metrics (e.g., Contents What is an HR report?
Benchmarking plays a crucial role in business, whether it involves internal assessments or comparisons with industry standards. By evaluating metrics such as sales and employee retention rates, companies can determine their strengths and weaknesses in relation to both their own past performance and that of their competitors.
Step 1: Identify Key Engagement Metrics The initial step to calculating ROI is identifying relevant metrics that reflect the impact of employee engagement on your organization. Here are some common metrics to consider: Productivity: Keep regular track of individual and team output after implementing engagement initiatives.
The platform provides comprehensive analytics that connect recruitment metrics with broader workforce data. It includes candidate engagement tools and visual analytics dashboards for tracking recruitment metrics. Analytics and Reporting Data-driven recruitment requires comprehensive metrics beyond basic time-to-fill statistics.
Date & Time: Thursday, September 26, 2024 at 2:00 pm ET Speaker: Mark Luetzelschwab , Director, PwC Workforce Transformation Sponsored by: Description: We all have heard of HR Benchmarking, but what does that really mean?
This competitive atmosphere now makes salary benchmarking highly important for HR managers. Salary Benchmarking is the deliberate process of comparing and evaluating talent remunerations and compensation packages in the UAE. Salary benchmarking ensures you address the situation before it escalates.
In comparison, only 17% would consider a community college and a mere 14% would opt for university training. More from Human Resource Executive Data shows that worker mobility has been waning for years, partly because companies fail to benchmarkmetrics that produce better outcomes. Chetan Jain, U.S.
You may know your own key hiring metrics like your average time to fill or how many qualified candidates you need to make a hire, but what’s the significance of these numbers? By comparing your own numbers against these benchmarks, you can determine what areas of your hiring process are normal and what areas need optimizing.
Like many higher ed HR professionals, you may know the value of these surveys for benchmarking salaries and evaluating diversity or pay equity. Rethinking Your Benchmark Institutions Your institution may be accustomed to benchmarking against institutions with similar enrollment numbers or total operating budgets.
Identifying, rinsing and repeating what’s working A striking feature of talent acquisition analytics is the ability to measure the success of your recruitment efforts with quantifiable metrics. In fact, premium insights at this level are achieved with a calculated combination and comparison of data from all your disparate HR systems.
Here’s how: Collect measurable, quantifiable data: You can use survey statistics to evaluate various metrics (e.g., employee satisfaction / employee engagement ) and benchmark them against previous quarters and top competitors. Tip 4: Benchmark the results Compare your survey results to internal, industry, or national benchmarks.
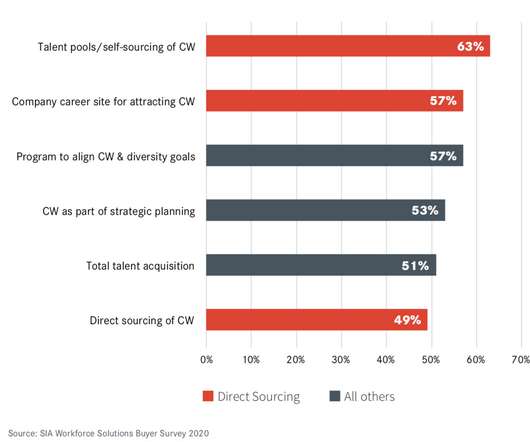
In fact, research indicates direct sourcing leaders outperform laggards by a staggering factor of 4:1 across all key metrics. By comparison, you would need 15 shortlisted candidates from traditional job ad sources to find a successful candidate. Do leaders and laggards have different types of challenges? Probably not.
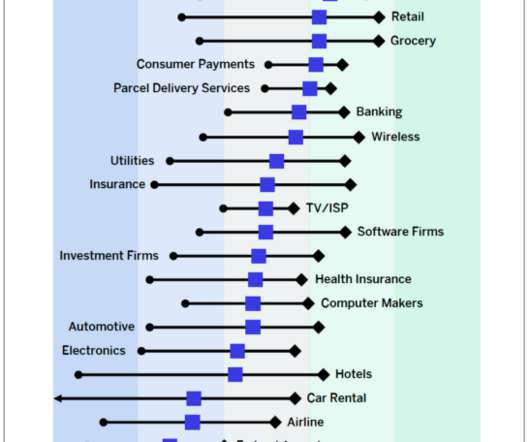
Are you interested in benchmarking your CX performance for comparing to companies like your own? The Ratings are a cross-industry, open-standard benchmark of customer experience measuring the performance of over 300 organizations across 21 industries. Standout findings for XMI customer rating benchmarks. Success ratings.
If you are looking for which specific metrics to measure, you can check our post 8 Key Intranet Metrics You Should be Tracking. This ensures discussion surrounding a metric focuses on how to improve it, rather than debating if it’s the right metric or not. Make a laundry list of all the intranet metrics you can think of.
Most HR metrics are “so what metrics” because they don’t create a sense of urgency or drive action. In direct contrast, the metrics recommended here have been proven to spur action because they allow managers to easily see performance trendlines, what actions must be taken, and what problems are coming.
Lack of effectiveness metrics – many accept that the goals of the process are to recognize results, provide feedback to address weaknesses, determine training needs, and to identify poor performers. Without “benchmark” numbers to set as a standard, inconsistency is guaranteed in large organizations.
This is because few CEOs are confident in the quality of their Human Capital metrics. Often what is shared with the C-Suite is what Sullivan calls the “So What” metrics, which elicit a “Why Should I Care?” Shifting to a metric model that is designed to influence executives. It includes benchmarkcomparison numbers.
Lack of effectiveness metrics — many accept that the goals of the process are to recognize results, provide feedback to address weaknesses, determine training needs, and to identify poor performers. Cross-comparisons are not required — one of the goals of the process is often to compare the performance of employees in the same job.
Employee engagement metrics are increasing in importance as ways of working become more complex and remote. These metrics are a vital indicator of employees’ level of connectedness and motivation. So what employee engagement metrics should your track to create a motivated, engaged workforce? Employee retention rate 3.
Time to hire is one of the best-known recruiting metrics. We will also list time to hire benchmarks, explain how it can be measured, and end with the five most effective ways to reduce time to hire. Time to hire is a common recruiting metric. The time to hire metric is also an indicator of candidate experience.
But making clear decisions about your talent management strategy is impossible without clear information—which is where talent management metrics come in. What are talent management metrics? Talent management metrics are a series of measures HR professionals use to track the effectiveness of a business’s talent management strategies.
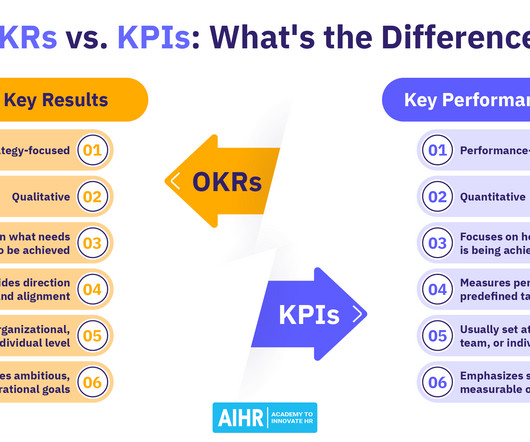
OKRs set ambitious goals, while Key Performance Indicators (KPIs) provide measurable metrics to track progress, creating a powerful framework for aligning strategy with execution. This article will explain the key differences, when to use each, and metrics to track when measuring each methodology. For example: Recruitment metrics (e.g.,
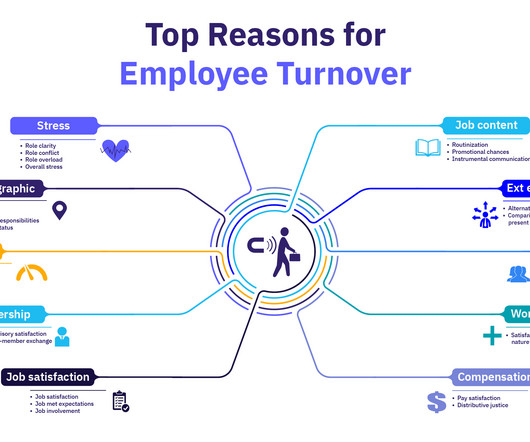
The external environment refers to the external factors that influence an employee’s decision to stay or leave their job, particularly through comparisons with other opportunities. How to measure compensation You can benchmark your pay data against market data to find out where your organization stands.
While we talk about ROI (Return of investment), this is actually a short terms financial return, in comparison with competitive advantage, which is a long term financial return. Our metrics should be designed in three different levels: job, team, and business unit. What is return in the domain of people?
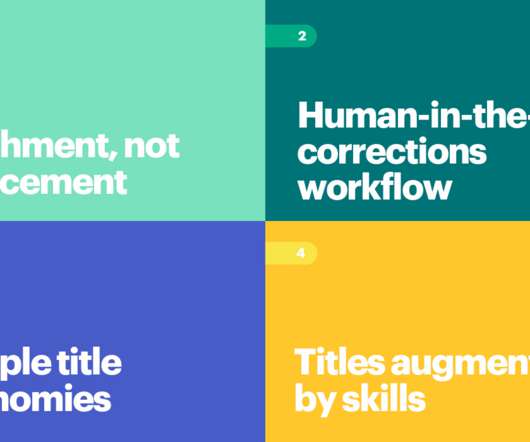
Without it, there’s simply no way to track metrics like retention or average tenure. This gives you the ability to not only better understand your people, but to draw comparisons between your workforce and the industry as a whole. Why does data standardization matter? Enrichment, not replacement.
Base Salary and Market Benchmarking The foundation of any compensation package is the base salary. To determine appropriate salary levels, organizations should engage in regular market benchmarking exercises. Market benchmarking involves comparing your organization’s salary ranges with those of competitors and industry standards.
KPIs (Key Performance Indicators) : These are the metrics that tell you how well your program is doing. Benchmarks If you’re not measuring your incentive program performance against industry benchmarks, you’re flying blind. A successful incentive program should get less costly and more profitable over time. By tracking KPIs.
Benchmarking compares an organization’s performance — using metrics and key performance indicators (KPIs) – to standardized data from the historical performance within your own company or other companies within your industry. Identify relevant metrics. Locate published benchmarks. Compared to what?
The study says that investing in DEI capabilities enables HR professionals to “look at intersectionality or diversity measures to understand time to hire or retention metrics in recruiting” or help “test a marketing program with an LGTBQ resource group to understand how it would resonate in that community.”
Results: Measurable outcomes that track success, such as retention rates, engagement levels, and diversity benchmarks. Additionally, set leadership equity goals and track inclusion metrics. Be sure to review these results and metrics regularly to help you refine your strategies and ensure they align with broader organizational goals.
The Employee Benefits Reporting Metrics, Trends and KPIs You Really Need To Know. With open enrollment quickly approaching, it’s crucial your benefits management system delivers the key employee benefits reporting and metrics you need to track to stay on track. Trends, Insights and Benchmarks You Really Need To Know.
However, developing a strong retention strategy centered around meaningful metrics can lead to happier, more productive employees and significant cost savings for a company. As an HR professional, what retention metrics should you be tracking? Key Takeaways What are Employee Retention Metrics? Importance of Retention Metrics.
Draw a comparison between must-haves and nice-to-haves. Implement systems that help you track the utilization metrics for each perk in terms of enrollment, participation, usage rates, etc. Make sure to use tools to benchmark your perks against the perks offered by competitors to ensure competitiveness.
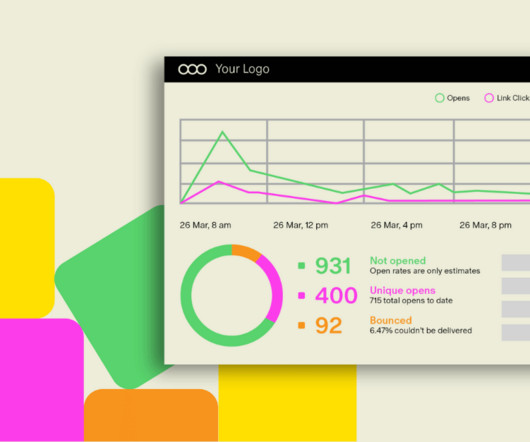
Beyond output quantity and the quality of the design, you need to collect, analyze, and present valuable metrics to illustrate the ROI of your team’s internal communications efforts (and educate those who otherwise discount it). . Which metrics matter? Connecting comms metrics with the bigger picture. Then work backward.
Survey functionality is also robust, as are benchmarking and normative datasets. DecisionWise, HSD Metrics, Work Institute, Newmeasures, and People Element. Once you’ve determined the optimal provider type for your company, you can make an exact “apples-to-apples” comparison and choose the best vendor.
Step 1: Decide what and how to measure Most companies' leaders struggle with defining the metrics to measure and the method of measurement. Step 2: Set targets and benchmarks Think back to your last leadership team meeting—what did you spend the most time discussing? The Securities and Exchange Commission in the U.S.
Consideration Stage: Provide comparison guides, case studies, and testimonials that showcase your solution’s benefits and differentiate you from competitors. By measuring key metrics, you can identify what’s working and what’s not, allowing you to refine your strategy and improve your results.
We organize all of the trending information in your field so you don't have to. Join 318,000+ users and stay up to date on the latest articles your peers are reading.
You know about us, now we want to get to know you!
Let's personalize your content
Let's get even more personalized
We recognize your account from another site in our network, please click 'Send Email' below to continue with verifying your account and setting a password.


Let's personalize your content