This site uses cookies to improve your experience. To help us insure we adhere to various privacy regulations, please select your country/region of residence. If you do not select a country, we will assume you are from the United States. Select your Cookie Settings or view our Privacy Policy and Terms of Use.
Cookie Settings
Cookies and similar technologies are used on this website for proper function of the website, for tracking performance analytics and for marketing purposes. We and some of our third-party providers may use cookie data for various purposes. Please review the cookie settings below and choose your preference.
Used for the proper function of the website
Used for monitoring website traffic and interactions
Cookie Settings
Cookies and similar technologies are used on this website for proper function of the website, for tracking performance analytics and for marketing purposes. We and some of our third-party providers may use cookie data for various purposes. Please review the cookie settings below and choose your preference.
Strictly Necessary: Used for the proper function of the website
Performance/Analytics: Used for monitoring website traffic and interactions
Data-Driven Decision Making Combining financial data—such as budgets and costs— with HR metrics, including talent acquisition and turnover rates, allows organizations to make informed decisions. This data integration enables businesses to identify trends, forecast future needs, and create a more strategic workforce plan.
Each year, we sponsor the SPI Professional Services Maturity Benchmark Report , a comprehensive survey of thousands of professional services organizations. This is clearly borne out by this year’s 2025 Professional Services Maturity Benchmark. in 2021 to just 68.9% Slowing Revenue Growth Revenue growth shrank to just 4.6%
Our Talent Screening Trends 2021 survey asked more than 1,500 organizations about their: Growth, hiring, and turnover; Technology and integrations; Background screening practices; Discrepancies with candidates; and. We asked employers how their workforces changed, and what challenges they faced, from January 2020 to January 2021.
Cisive Insights: Talent Screening Trends in a Global Pandemic (A Benchmark Report) Oct. Our Talent Screening Trends 2021 survey asked more than 1,500 organizations about their: Growth, hiring, and turnover; Technology and integrations; Background screening practices; Discrepancies with candidates; and. Jenni Gray Copywriter.
According to Gallagher’s research, 62% of organizations expect increased revenue growth in 2021, and more than half expect increased headcount. Enable employee wellbeing and drive organizational success with a data-driven approach to total rewards. As employers look to restaff, incorporating employee retention efforts is vital.
Advertisement Yet, without a strong focus on analytics, reaching those ER objectives will be an even tougher challenge, according to HR Acuity’s fifth annual Employee Relations Benchmark Study. Almost three-fourths of organizations expect employee relations resources to remain the same for the entirety of 2021.
25 on the Fortune 100 Best Companies to Work For® List , the answers lie in the data. Perception is not necessarily reality; it really does take looking at the data,” says Michael Matthews, chief diversity, inclusion, and corporate responsibility officer. We use data to assess where we’re at and where we want to go.”.
The global Artificial Intelligence in the Recruiting Industry benchmark survey , from CEIPAL, an SAAS front- and back-office staffing company operations vendor, found that 79% of enterprise staffing firms (with more than 100 recruiters) will have done the same.
This year, 2021, is a particularly unique year. While 2020 was the year that gave us the COVID-19 pandemic, mandated shutdowns, recessions, hiring freezes, and a dramatic shift to remote work, 2021 can almost be thought of as the aftermath. According to our data, remote work has some staying power. Remote work is here to stay.
The HR trends for 2021 focus on the fundamental shifts taking place everywhere: from jobs to in-the-moment skills; from a focus on D&I as an HR program to D&I as a core business competency; from supporting collaboration through in-person proximity to supporting collaboration through digitally-enabled teamwork.
A thorough compensation analysis provides the data and insights for critical decisions as it relates to salaries and total benefits for employees. A compensation analysis uses internal and external data to determine whether an employer rewards employees fairly or not for the work they are doing.
While experiences of fair pay and healthy work-life balance improved from data collected in 2021, employees’ mental health hasn’t budged. In 2023, 55% of employees at the typical workplace said they had a psychologically and emotionally healthy work environment – a two-point increase from 53% in 2021.
What is completely different in 2021 is the sheer number of organizations that will simultaneously be engaged in redesign, the pace at which new structures and approaches will form, and the speed at which iterations and changes to parts of these new structures will take place. Example of External and Internal Market Demand by Geography.
In fact, according to Zywave’s 2022 Attraction and Retention Benchmarking Overview, finding and keeping great employees is considered one of the top-five problems by 75% of businesses surveyed. Career website Zippia found that the average time-to-hire in 2021 was 42 days.
This is where benchmarking metrics for your recruiting funnel come into play. By measuring the right metrics at each stage of the funnel, you can make data-driven decisions that improve your overall recruitment strategy. Industry benchmark: On average, offer acceptance rates hover around 85-90%.
Further, revisions for job gains in July and August have escalated to a combined 119,000, propelling each month over the 200,000 benchmarks. Jobs Available Data Source: U.S. This increase from July suggests a return to high post-pandemic numbers witnessed in 2021 and 2022. Workforce Participation Data Source: U.S.
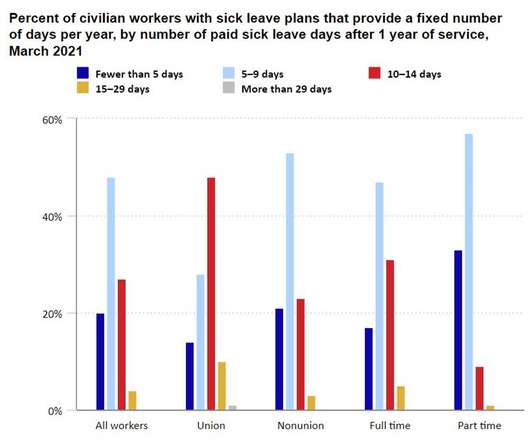
To determine their average number of sick days, we examined the most recent data from the Bureau of Labor Statistics (BLS). According to the BLS , in March 2021, 79% of U.S. Per the BLS , 77% of private sector workers had access to paid sick leave in March 2021. 69% received a fixed number of paid sick days. a PTO bank).
Jobs Available: Data sourced from the U.S. This increase from July suggests a return to the high post-pandemic numbers witnessed in 2021 and 2022. The yearly pay gain was 4.2%, the lowest since June 2021. Bureau of Labor Statistics (January 2022–September 2023) reveal that job openings continue to outpace hires, with 9.6
2022 Benchmark Report Takeaways Although healthcare organizations share a common purpose in providing critical care for people, the specific hiring process and screening needs of hospitals, long-term care facilities, pharmaceutical companies, and healthcare staffing firms often differ. View 2022 Benchmark Report Takeaways Blog 2.
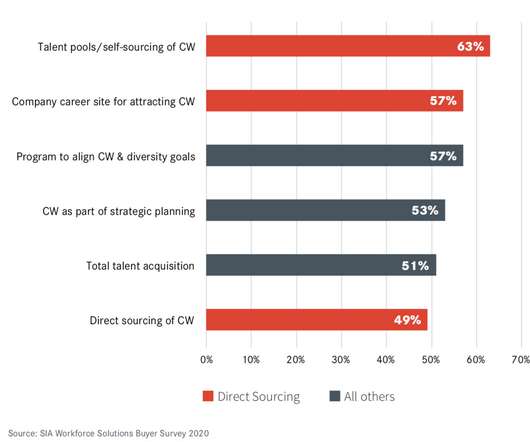
Meanwhile, the latest data from Ardent Partners indicates that a growing percentage (46.5%) of the US workforce is considered ‘non-employee’. To that end, the SIA 2021 Direct Sourcing report finds 58% of the leaders outsource the overall process to a Managed Direct Sourcing (MDS) supplier. . Data privacy. Discrimination.
Used correctly, surveys aren't mere checkboxes; they're strategic, data-driven levers that shape employee experiences and directly fuel organizational success. Using survey data alongside predictive HR analytics, you can pinpoint precisely which teams, departments, or demographics have a higher attrition risk.
Misinterpretation and Discontent Without proper context, employees may misinterpret salary data, leading to frustration or resentment. Organizations should provide clear explanations of how pay decisions are made, including factors like experience, skills, performance, and market benchmarks.
Clinch uses Bob’s Surveys to gain employee feedback and uses the data they collect to drive company-wide decisions. Since 2021, their primary focus has been on growing their global team, and they have hired a diverse and talented workforce of over 130 employees that span nine countries across Europe, Asia, Africa, and the US.
The global Artificial Intelligence in the Recruiting Industry benchmark survey , from CEIPAL, a SAAS front-and back-office staffing company, determined that more than ¾ of enterprise staffing firms with 100+ recruiters will follow suit.
How to Leverage LMS Data Analytics for Better Decision-Making in Corporate Training GyrusAim LMS GyrusAim LMS - In today’s competitive business landscape, Learning and Development (L&D) programs are key drivers of employee growth, retention, and overall business success. billion in 2020–21.
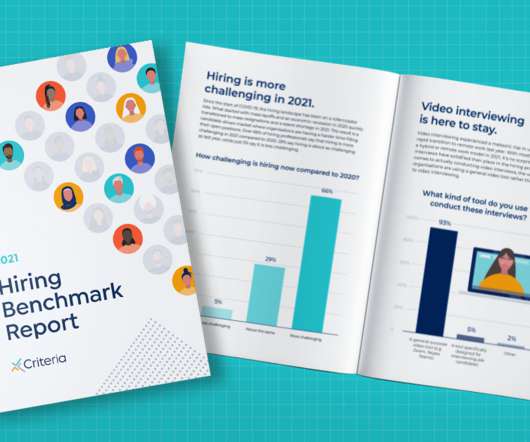
Today, we released the 2020 Hiring Benchmark Report , our third annual report based on a survey of 400+ hiring professionals. And when looking towards 2021, the majority (66%) of hiring professionals feel positive about the future health of their organizations.
Our mission at Embroker has always been to turn the process of purchasing business insurance into one that is fully transparent and guided by accurate and reliable data. By harnessing advanced technology and data, we strive to help startups get the right coverage and avoid potentially costly exposure in their most critical stages of growth.
A recently released SPI Professional Services 2023 PS Maturity™ Benchmark report has revealed that: PSOs that have measured and optimized performance using technology, and continue improving collaboration among their internal and external stakeholders, outperform those that don’t on most counts. There are outliers, however.
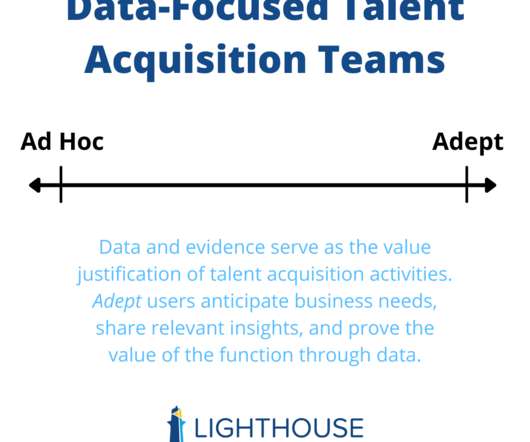
But we’ve found in the research that talent acquisition teams fall on a spectrum when it comes to using data. There are two opposite ends of the spectrum, and most organizations fall somewhere in between: Ad Hoc : using data, evidence, and metrics when requested or occasionally. Sources and Types of Talent Acquisition Data.
Great Place To Work® analyzed data from more than half a million employees with parenting responsibilities to create a list of the Best Workplaces for Parents™. Cisco also ranked number 1 in 2021 and 2020. Strong parental leave not only benefits working parents, but helps organizations with employee retention and equality.
It’s a truth executives are keenly aware of as they hit the ground running in 2021. . In its 2021 CEO Benchmarking Report , The Predictive Index surveyed 160 CEOs from various industries, asking them about their primary concerns and priorities post-COVID. That goes for people data, just like any other metric.
The real-time data recording views, shares, click-throughs and swipe-ups can provide valuable insights to recruiters so they can adapt campaigns quickly. At the end of December 2021, there were 2.91 Analytics is tough to do on your own, so you need the right technology stack that enables you to pull relevant data.
2021 Benefits Benchmark Report – Top 3 Big Hits . If you want all the data we’ve compiled, we salute you. Our platform data shows us that the offering a solid benefits package cost employers an average of $8,094 per employee, reflecting a relentless increase in cost that shows no signs of stopping. Benefit Name .
Close competitive gaps faster with our XMI Customer Ratings benchmarks. Qualtrics XM Institute’s customer ratings provide a cross-industry, open-standard benchmark of customer experience. Qualtrics XM Institute’s customer ratings provide a cross-industry, open-standard benchmark of customer experience. Here’s what to expect.
In fact, according to survey data from our annual Hiring Benchmark Report , hiring professionals have ranked this as their top challenge for three consecutive years. The post Finding More Qualified Candidates in 2021: Webinar Recap appeared first on Criteria Corp Blog - Pre-Employment Testing.
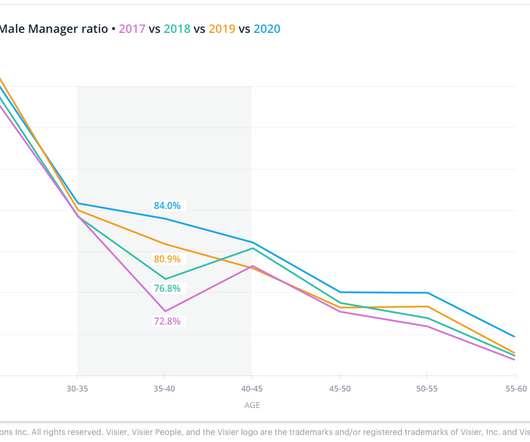
This is true gender equity by design–and the data suggests that some organizations are better at moving the needle on outcomes than others. In another study released last year, we found cracks in the glass ceiling, with our customer organizations replacing males with females at higher rates in lower management.
Do not fret, though, because this article lists the best compensation planning and analysis tools 2021 to maximize the effectiveness of employee management. . Our List of Best Compensation Tools in 2021. The solutions that are provided are based on quality data. Total Compensation Solutions. MSI Global Transformation Solutions.
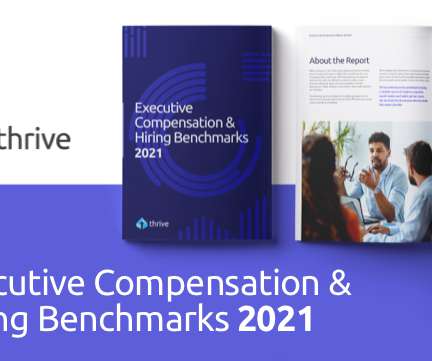
Download Thrive’s 2021 Executive Compensation & Talent Benchmarks Report. The public market rebounded from the COVID-19 pandemic with a vengeance in 2021, with each quarter producing more open searches, raising more equity, and deploying more capital than the one before. In-State and Out-of-State Comp is Leveling Off.
In fact, in the wake of the 2021 Renewable Energy and Jobs Annual Review, an estimated 38 million roles are expected to involve some sort of renewable energy or sustainability-focused skill by 2030 – A significant increase from the 12 million reported in 2020. The most intriguing part?
The panelists explored some of the most interesting data from our 2020 Hiring Benchmark Report. The Hiring Benchmark Report is an annual report that Criteria publishes based on a survey of hiring professionals from around the globe and across all industries. Benchmarkingdata based on industry.
2020 shook up the workplace, resulting in a shift to remote working and a reassessment of workplace culture – we showcase five top employee engagement tools to dial up your employee engagement in 2021. With many predicting a mental health crisis in 2021 , there’s never been a more important time for HR to engage employees.
Normally, this wouldn’t be worth commenting on, but the number comes from the data of millions of employees, and that one percent represents well over 100,000 workers. The number I’m referencing is the average response rate on census surveys from the Perceptyx benchmark database.
By training UKG GenAI models on 30 years of proprietary Great Place To Work research and strategies, the UKG Great Place To Work Hub will proactively surface suggestions and key data points to help organizations understand where their culture stands today and more rapidly advance equity and opportunity for all going forward. and WESTON, Fla.
Base Salary and Market Benchmarking The foundation of any compensation package is the base salary. To determine appropriate salary levels, organizations should engage in regular market benchmarking exercises. Market benchmarking involves comparing your organization’s salary ranges with those of competitors and industry standards.
We organize all of the trending information in your field so you don't have to. Join 318,000+ users and stay up to date on the latest articles your peers are reading.
You know about us, now we want to get to know you!
Let's personalize your content
Let's get even more personalized
We recognize your account from another site in our network, please click 'Send Email' below to continue with verifying your account and setting a password.


Let's personalize your content