This site uses cookies to improve your experience. To help us insure we adhere to various privacy regulations, please select your country/region of residence. If you do not select a country, we will assume you are from the United States. Select your Cookie Settings or view our Privacy Policy and Terms of Use.
Cookie Settings
Cookies and similar technologies are used on this website for proper function of the website, for tracking performance analytics and for marketing purposes. We and some of our third-party providers may use cookie data for various purposes. Please review the cookie settings below and choose your preference.
Used for the proper function of the website
Used for monitoring website traffic and interactions
Cookie Settings
Cookies and similar technologies are used on this website for proper function of the website, for tracking performance analytics and for marketing purposes. We and some of our third-party providers may use cookie data for various purposes. Please review the cookie settings below and choose your preference.
Strictly Necessary: Used for the proper function of the website
Performance/Analytics: Used for monitoring website traffic and interactions
Measuring critical employee performance metrics offers organisations key benefits for attracting and retaining top talent while meeting operational imperatives. That’s why today’s software applications for measuring key performance metrics are so valuable. The words vary based on what’s being measured.
With people analytics solutions in the drivers seat, you can use historical trends and current workforce demographics to project future headcount needs based on anticipated growth, retirements, and promotion paths. By tracking these metrics, you can identify bottlenecks and optimize each stage of the process.
Hire-to-Retire (HTR) refers to the comprehensive employee lifecycle management process that spans from the moment an individual is recruited until they retire or exit the organization. The Stages of the Hire-to-Retire (HTR) Process HTR involves several stages that align with an employee’s career trajectory.
But among hundreds, if not thousands, of people metrics, what should your HR systems report on? Here are 24 metrics we typically see C-suites asking for most. Let’s explore the metrics we often see C-suites asking HR teams for – first the fundamentals, then more sophisticated reports that power advanced modelling and forecasting.
Headcount report usually has information on every employee relating to: Job status (active or inactive) Job title Schedule status (part-time, full-time, contract) Time in role / tenure Salary Exemption status (exempt or non-exempt from receiving OT pay) Age Gender Ethnicity Education level Location Retirement age Veteran status.
Importance of HR analytics HR analytics examples Key HR metrics Data analytics in HR: How to get started How to transition from descriptive to predictive and prescriptive analytics in HR HR analytics certification FAQ What is HR analytics? Contents What is HR analytics? What is HR analytics used for? We discuss more real-life examples below.
Projections are made based on turnover rates—the number of resignations, retirements, promotions, and terminations that have occurred so far—to help inform how this will affect the future workforce. Metrics such as productivity levels and undesired behaviors of ill-suited employees can be tracked. Improve company culture.
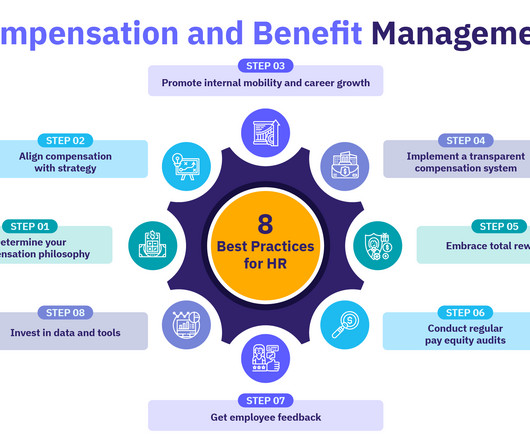
Common employee benefits include health, dental, vision, and life insurance, and retirement savings plans. Benchmarking your organization’s benefits, programs, and policies against industry standards and best practices is also helpful during the design phase. We’re here to help.
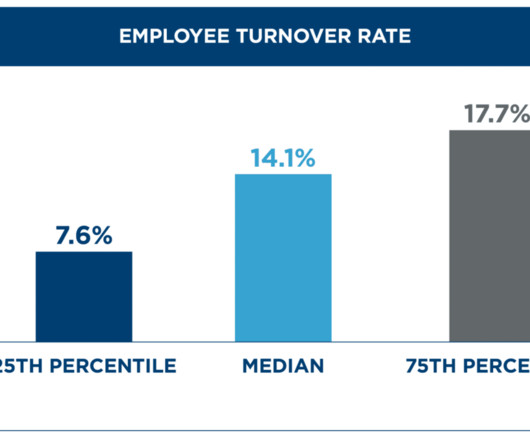
Key Metrics for Calculating Turnover To calculate a simple turnover rate, you only need two figures: Employee departures: The number of employees that left within the period you’re calculating for. Bureau of Labor Statistics is a great resource for benchmarking. Constantly replacing employees can be a drain on resources.
Market-based compensation reviews: Uses industry benchmarks, competitor data, or economic factors to make decisions on compensation adjustments. Making these decisions requires research, benchmarking data, and leadership advice on budgets, investments, growth, and strategy.
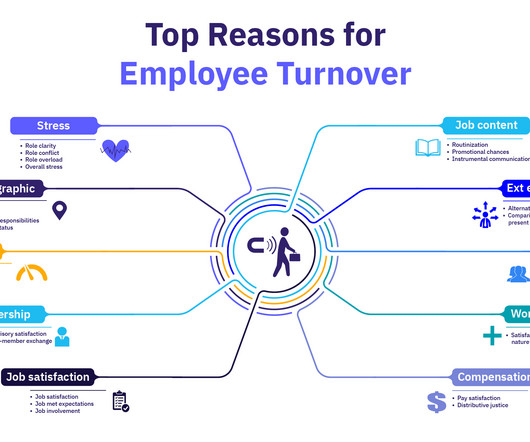
Employee turnover rates are a crucial metric for organizations to monitor, as they show how frequently employees leave the company. Beyond just tracking numbers, understanding turnover rates requires identifying the root causes of employee departures and developing effective retention strategies in response.
Establish and track employee experience metrics: Data provides tangible evidence of what works well and which issues to address to enhance the employee experience. This metric helps you gauge the employee experience levels in your organization. Collect employee feedback and external data to benchmark against competitors.
Unfortunately, many companies still base their talent plans on unreliable sources and methods such as using country retirement age instead of actual retirement age data, outdated benchmarks, and financial headcount budgets with no historical trends or link to business strategy, and sadly, gut feel.
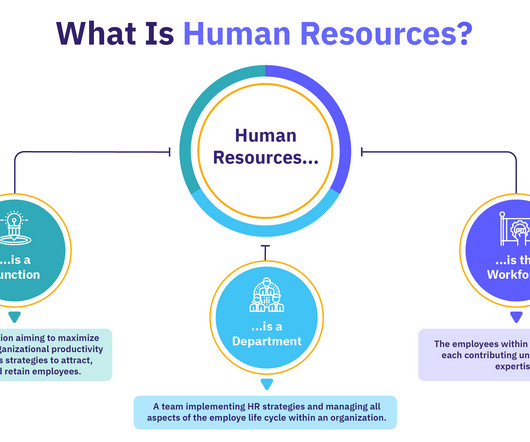
As a department, it is responsible for managing HR activities from recruitment and onboarding, compensation and benefits, learning and development, performance management, and employee relations to separation or retirement. It includes reviewing organizational and HR metrics to measure HR initiatives’ effectiveness on business results.
Most HR metrics are “so what metrics” because they don’t create a sense of urgency or drive action. In direct contrast, the metrics recommended here have been proven to spur action because they allow managers to easily see performance trendlines, what actions must be taken, and what problems are coming.
Baby Boomers make up a significant portion of the company’s current workforce, and their retirement over the next few years could cause serious staffing shortages in key positions. People can easily find the metrics they desire in a convenient, easy-to-use platform. Being above the benchmark should aid in attracting applicants.
Includes topics such as retirement planning, health benefits, and executive compensation. Key Features: Detailed study of compensation metrics, variable pay, and incentives. Key Features: Covers compensation analytics, salary benchmarking, and incentive programs. International recognition and flexible online learning options.
Some employees leave due to retirement, restructuring, or performance issuesthese departures may not significantly impact a company. Offer Competitive Compensation and Benefits To retain top performers, HR should conduct regular salary benchmarking and offer competitive pay packages.
You can also separate your voluntary turnover (employees choosing to quit or retire) from your involuntary turnover ( terminating employees due to poor performance ) in your turnover calculation. Voluntary turnover refers to all the instances when employees choose to leave your company, either by quitting or retiring.
But tracking, managing, and lowering this metric isn’t as simple as it seems. I feel like we’re constantly losing people”) into hard facts you can compare to industry benchmarks (e.g. Not only can replacing an employee cost 33% of their annual salary , but watching people leave constantly can tank morale for everyone else.
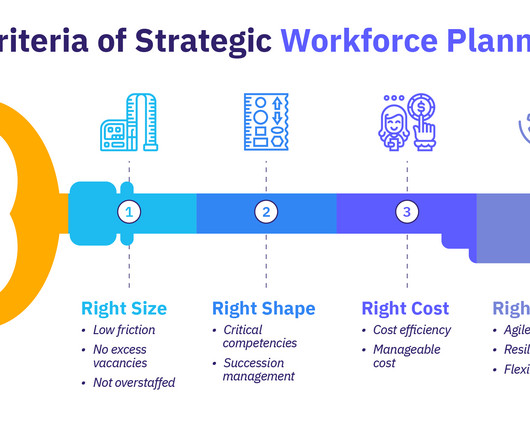
As explored in our HR Metrics & Dashboarding Certificate Program , the goal of strategic workforce planning is to have a workforce with the right size, shape, cost, and agility. From this cumulative data, you can calculate, analyze, and report on HR metrics. It is conducted by HR but led by business and HR leaders.
Companies with data-driven PeopleOps teams use a range of metrics to gauge their success in retaining their workforce. This article explores these employee retention metrics. We’ll look at key metrics to track, as well as calculations, best practices, case studies, and more. What are Employee Retention Metrics?
According to Talent Board’s 2022 North American Candidate Experience (CandE) Benchmark Research Report, resentment among new hires increased, meaning that they had more negative experiences last year than they did in 2021. You can compare these turnover metrics with new hire turnover to see if there’s an overlap.
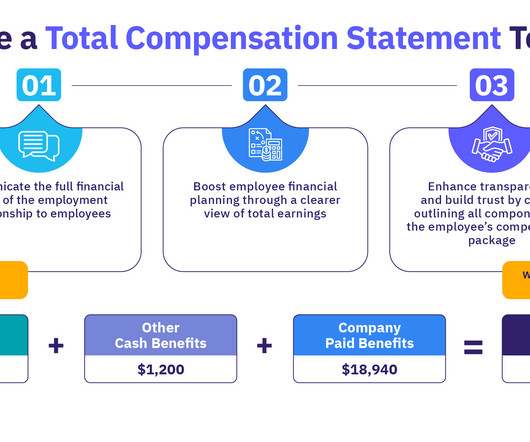
It outlines all the financial and employer-paid benefits an employee receives, including bonuses, incentives, retirement contributions, health insurance, paid time off , and other perks like wellness programs or tuition reimbursement. market benchmarks, performance metrics ). 50% match on the next 2% of contributions.
Many that have graduated from metrics to analytics use it very simplistically, often to respond to one-off data requests such as “how many employees were hired last month?” For example, an organization that is at the Reactive level can answer basic questions like, “ How many people retired last year? ” Level 2: Standardized.
As baby boomers head into retirement, companies will face a huge shortage of skilled workers to replace them. Here are a few demographic metrics you should be monitoring: 1. Metric to watch: Diversity of interviewed candidates. Metrics to watch : Ethnic diversity by hiring stage / Female diversity by hiring stage.
These measures include laws that prohibit employers from asking about previous salaries, employer reporting on a number of equality metrics and requiring some form of pay transparency. A wage gap also increases the likelihood that women will be living in poverty, both during their work years and in retirement.
Base Salary and Market Benchmarking The foundation of any compensation package is the base salary. To determine appropriate salary levels, organizations should engage in regular market benchmarking exercises. Market benchmarking involves comparing your organization’s salary ranges with those of competitors and industry standards.
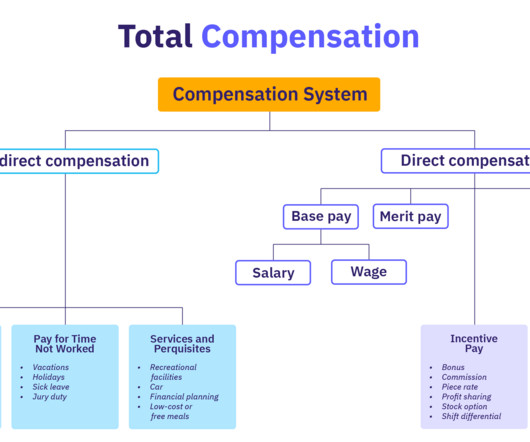
The template is usually divided into various sections or tabs, including financial (or direct) compensation, benefits, retirement planning, and other benefits (e.g., Retirement planning: This part of the template covers things like the employee’s 401(k) plan, pension, profit-sharing plans, and stock options (if applicable).
We actually create benchmarks so you can compare to other organizations. I’ll actually talk about our best-in-class benchmark today. That’s how we actually know that Joy, Tim, and Tina’s organizations are within those best-in-class benchmarks. And so, let me first talk about our best-in-class benchmark.
Options may include health and wellness programs, retirement plans, or lifestyle benefits like gym memberships and childcare support. Analyze metrics such as participation rates, employee satisfaction, and retention rates to evaluate the program’s impact.
As of now, only 50% of HR departments state that they use quantifiable metrics and benchmarking in workforce development and only 47% say they know how to extract meaningful insights from the data available to them. employees is competitive compensation (84%) followed by retirement plans (75%), and vacation time (62%).
They include health insurance, paid time off, retirement plans, etc. Implement systems that help you track the utilization metrics for each perk in terms of enrollment, participation, usage rates, etc. Make sure to use tools to benchmark your perks against the perks offered by competitors to ensure competitiveness.
A competitive compensation analysis is your tool for unlocking actionable insights to benchmark your pay rates and create a compensation package that stands out. A competitive compensation analysis involves evaluating your organizations pay and benefits packages against industry benchmarks. What Is Competitive Compensation Analysis?
Employee attrition : Often used interchangeably with turnover , employee attrition is a gradual reduction in staff, usually through natural causes like retirements or resignations, without actively replacing those employees. Benchmarking data can give you an indication of whether you are underpaying or overpaying your people.
As Baby Boomers retire, the need to shape younger workers to fill available management roles grows stronger. Key Metrics. Depending on the needs of your business, as well as the industry, these metrics can vary, but they should all focus on the happiness and engagement of your workforce. Measurement Methodology.
But in order to be actionable for organizations, benchmarking data—whether about turnover or anything else—needs to be interpreted as part of a broader ecosystem. Find the organizations that most closely match your own to ensure that you are comparing “apples-to-apples” as much as possible in your benchmarking.
Preparing for the Future: Key Actions for HR Leaders As we look toward the future of total rewards, several key actions can help organizations stay ahead of these trends: Conduct Regular Assessments: Regularly evaluate your total rewards program against industry benchmarks and employee feedback.
It includes health insurance, retirement schemes, vacation days, bonuses, equity shares, and additional benefits such as flexible work schedules or educational stipends. Retirement savings: Contributions to retirement plans such as the 401(k) plan in the US, are a key factor in long-term financial security for employees.
When designing a robust executive compensation plan , there are hundreds of factors to analyze and various success metrics to weigh. A robust compensation structure may be the difference between a company’s long-term growth and a series of disappointments and below benchmark performance. Other retirement plans.
As Baby Boomers retire, the need to shape younger workers to fill available management roles grows stronger. Key Metrics. Depending on the needs of your business, as well as the industry, these metrics can vary, but they should all focus on the happiness and engagement of your workforce. Measurement Methodology.
When it comes to compensation metrics , accurate data is essential for benchmarking the competitiveness of your packages. Indirect financial benefits include equity packages, stock options, health benefits, life insurance, pension plans, and retirement funds. Comp Analyst by Salary.com Comp Analyst is strong on data analytics.
The amount of merit increase an employee receives should be based on metrics set by the organization and be in line with market rates for incentives. To create a competitive compensation strategy benchmark positions in your organization with similar positions in your competitors’ organizations. Other retirement plans.
There are so many different metrics and acronyms, you’re forgiven if you don’t recognize this one. NPS may be the one metric you’ve never heard of that meets the speed and flexibility of the modern workforce. eNPS allows you to easily benchmark engagement across different segments, over time, and relative to competitors.
We organize all of the trending information in your field so you don't have to. Join 318,000+ users and stay up to date on the latest articles your peers are reading.
You know about us, now we want to get to know you!
Let's personalize your content
Let's get even more personalized
We recognize your account from another site in our network, please click 'Send Email' below to continue with verifying your account and setting a password.


Let's personalize your content